Table of Contents
In this tutorial, you’ll learn how to trade using the Three White Soldiers Candlestick Formation. Three white soldiers is one of the most popular Candlestick formations that traders are using in their daily trading. We’ll go through steps on how to read candlesticks and find the three white soldiers formation.
KEY TAKEAWAYS
- Technical analysts use the three white soldiers pattern to predict a trend reversal.
- The three white soldiers pattern is thought to be a fairly reliable reversal signal by analysts and traders.
- The bullish pattern has three consecutive candles—openings within the previous candle’s real body, closings above its high.
- The three white soldiers pattern can appear either at the end of a downtrend or after a period of consolidation—neither situation is considered particularly strong bullish.
- The three white soldiers pattern is the bearish counterpart of the three black crows, and both are commonly used as significant signals.
What is the Three White Soldiers Pattern?
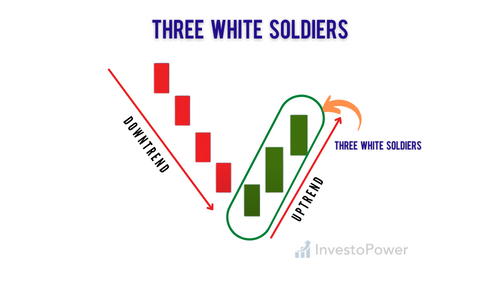
The three white soldiers pattern is a bullish reversal candlestick pattern that consists of three consecutive long white candles with little or no upper shadow. It indicates that a downtrend is likely to reverse and turn into an uptrend. A three white soldiers pattern can appear at the end of a downtrend or in the middle of one.
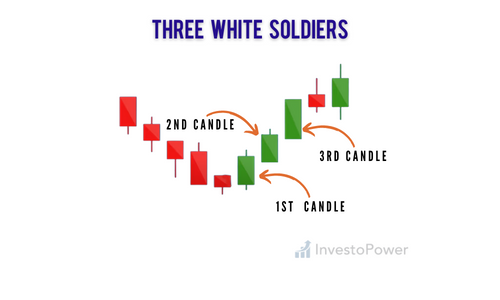
The first candle should open near the low of the previous candle and close near its high, indicating that bulls have taken control. The second candle should open higher than the first and close near its low, demonstrating that bears are still present but losing control. The third candle should open higher than both previous candles’ open and close near its high, showing that bulls have taken full control and have successfully reversed the trend.
This formation signifies that bulls have regained control over the market and is considered as an indication of an upcoming bullish movement. Therefore, it can be used to identify potential buy opportunities in an uptrend.
A buy order should be placed at least one or two days after the pattern occurs. A stop loss should be placed below the lowest low of the three candles while a profit target should be set at least to the nearest resistance level above the highest high of these three candles.
Conditions of trading Three White Soldiers:
Here are some of the conditions that must be met before you can identify a three white soldiers pattern:
Condition 1:
The first candle indicates a continuation of the downtrend and signals that bulls have returned to the arena.
Condition 2:
The second candle must be bullish too. The opening price of this candle must fall within the real body of its predecessor, and preferably between its midpoint and closing price
For a bullish candlestick pattern to form, the closing price must be higher than both the previous candle’s opening and closing prices.
Condition 3:
A third bullish candlestick with no or small shadow should form after two bullish ones.
The opening price of the second candlestick should be within the real body and close to, if not at, its midpoint.
The closing price of the third candle should be higher than the previous candle’s closing price and should remain above it.
The third candlestick has almost the same conditions as the second.
Why the Three White Soldiers Pattern Is a Bullish Indicator
The three white soldiers candlestick pattern is a bullish reversal pattern that indicates a continuation of an upward trend. This pattern can be seen on any time frame, although it’s most common on lower time frames such as the one-minute or five-minute charts. The first two candles show strength in price and are usually green with long bodies. The third candle has no shadows or very small ones, which shows that buyers were in control during this period of trading.
Three white soldiers refers to three large bullish candles, each closing higher than the preceding one and with no gaps between them—each candle opens within the body of its predecessor.
The bulls also kept the price of the security within a tight range, by either maintaining short wicks or not forming any at all.
The large bodies of all three candles and the lack of any substantial upper shadows indicate that bullish momentum is strong.
In addition to its other properties, the three white soldiers bullish reversal pattern is more likely to be a solid signal if it occurs on increased volume.
How to Identify the Three White Soldiers
To correctly identify the three white soldiers pattern, remember that not all instances of the trend are tradable.
The pattern has several requirements in order for it to be valid and significant enough to trade.
To qualify each instance of the three white soldiers candlestick, traders should maintain a three-step process:
- Market context — a pattern usually develops just before a bear market ends.
- Size of the candles — The candles need to be of substantial size and shape.
- Volume confirmation — a trend reversal is signaled by an increase in trading volume.
Market Context –
As previously mentioned, the three white soldiers candlestick pattern is invalidated if its location in relation to price action does not reflect a change in trend or an important support level.
For example, if a pattern forms in the midst of consolidation, trend reversal is less likely. Also, when trading range-bound markets you experience thin profit margins because resistance levels will cause the pattern to run out steam quickly.
However, it can also be used to confirm support levels or trend reversals that occur later on in the market cycle. For example, if a trader sees the three white soldiers candlestick pattern after an uptrend and is unsure whether or not to enter a trade, they could wait for confirmation from another indicator like volume or MACD (moving average convergence divergence).
While there is a downtrend, traders wait for the three white soldiers to emerge before feeling confident enough in sellers’ defeat that they will purchase stock.
Candle Size –
The second requirement for the three white soldiers is that all of its candlesticks are bold. Ideally, we want to have larger candles than those around it.
The second candlestick should not extend past the middle price range of the previous day. The same holds true for last candles, which indicate little selling pressure.
The larger the candles, the more powerful they are. We want to see large white candlesticks with long tails and no shadows. The three soldiers should have candle bodies that are at least two times larger than those around them. A good way to measure this is by looking at the relative strength index (RSI), which measures momentum as well as overbought/oversold conditions of an asset or market. When all three of our white soldiers are closing above their opening price, it signals that buyers have been in control during the entire session.
Volume Confirmation –
Finally, the three white soldiers can be confirmed by rising volume. The volume should be above average and confirm the strength of the move. It’s not enough to have three white soldiers that close above their opening price; you also need confirmation from rising volume to ensure that buyers are in control of the market.
If a large volume of trades occur when the white soldiers appear, then this is an indication that investors are actively buying. If so few people are trading during this period that you can count on one hand how many shares have changed hands during the last two minutes, then it’s likely a bull trap and best avoided.
In sum, traders need to look for an increase in volume when trying to validate the strength of a bull market.
Interpreting the Three White Soldiers Candlestick Pattern
The three white soldiers candlestick pattern is a bullish reversal pattern that can be used by traders to identify potential turning points in the market. This pattern is formed when there are three consecutive long-bodied candles with gaps between them, creating a trend reversal. As such, it is considered an important indicator for many traders who use technical analysis as part of their trading strategy.
The characteristics of Three White Soldiers pattern are as follows:
- Three consecutive white or green candles with a large trading range and volume—as opposed to price only—are an indication of trader sentiment.
- These candles are all of similar size.
- The candles have short upper and lower wicks.
- The second candle’s low must be higher than or equal to the middle price of the previous day, and the last candle’s low must end above this value.
- The opening price of the candle is within the range of values covered by previous candles.
- The second candle’s closing price is higher than its opening one and also higher than the high value set by the first candle.
- The third candle’s closing price is higher than the second candle’s high.
The three white soldiers visually appear to be moving forward without obstruction, which helps many traders determine whether the market is bullish or bearish. In this case, bulls are prevailing over bears.
When there are three consecutive bullish days, with each day’s closing price near the high end of its trading range—and no obvious bearish patterns—the market is considered to be in a bull phase.
Three white soldiers candlestick patterns can be useful for determining whether a rally might continue, but it’s wise to confirm that shift in market sentiment by looking at other technical indicators like the moving average or stochastic oscillator.
When three consecutive candlesticks form what’s called a “Three white soldier” pattern, it’s generally considered to be a bullish sign in technical analysis. In this article, we’ll take an in-depth look at what white soldiers are and how they can be used to predict future price movements.
Risk Management with Three White Soldiers
Managing risk wisely can help you succeed where so many others have failed in the volatile cryptocurrency market. Because the risks involved in any setup are unpredictable, never risk more than 2% of your portfolio on one trade.
Firstly, with the three white soldiers pattern as a reversal signal, traders may decide to set wider stop-losses. If you’re risking money that is more important to you than the potential gains, then your losses will affect you disproportionately.
Secondly, you should only trade in candlestick patterns that offer a minimum 1:2 risk-to-reward ratio. There’s a good chance the reward will be greater than your investment.
And finally, always use a stop-loss. This will protect you from losses that could be devastating to your portfolio. In the case of the three white soldiers candlestick pattern, placing a stop-loss below the lowest low of the trend may be appropriate.
How to Trade Using the Three White Soldiers
The three-white-soldiers pattern is just one of the many technical indicators that investors can use to identify entry and exit points in a given security. However, it is an effective tool for those investors who like to trade reversals in the market. Investors should look at other indicators such as the stochastic oscillator before making any trades based on this indicator.
There are two common approaches to trading the three white soldiers pattern.
- Buy when a security’s price breaks through three white soldiers.
- Buy at pullback
In this case, the three white soldiers pattern can be used to enter a long position. However, traders who have been following the downtrend can use this reversal of price as a time to exit their trades. Bears will close out their short positions when they see the three white soldiers pattern on the price chart.
In the three white soldiers pattern, a significant price move that follows this trend is often followed by an overbought market. Technical indicators are useful in revealing what happens behind the curtain during such periods of excess demand or supply.
For instance, a stochastic oscillator may have moved above 80 to signal overbought readings. During periods of consolidation, the price trends without making any significant moves; this gives the oscillator enough time to reset.
Buying on a pullback is the best way to find great opportunities. When you’re looking to buy, look for pullbacks in the price action. You can use different types of technical indicators to help with this process. For example, a stochastic oscillator might be overbought due to the bullish trend that preceded it; when this happens, the price often pulls back before continuing higher. This gives you a chance to pick up some shares on sale.
Trading Tips for Three White Soldiers Pattern:
- Check for confirmation: Use other indicators such as moving averages, MACD and RSI to confirm a potential three white soldiers pattern before entering a trade.
- Wait for confirmation: Enter only when there is confirmation from other indicators such as moving averages, MACD and RSI before entering a trade after spotting this pattern by itself. If you do not wait for confirmation from these indicators
Three White Soldiers vs. Three Black Crows:
If you’re still new to candlestick analysis, the Three White Soldiers is a bullish reversal pattern. The Three Black Crows is its bearish counterpart.
The patterns are identical except for the color of each body. The opening price is higher than the closing price, and then it closes at or near its high point.
Three White Soldiers: buy signal-Bullish reversal pattern.
Three Black Crows: sell signal-bearish reversal pattern.
The Limitations : Three White Soldiers.
The three white soldiers pattern is not a crystal ball. Even though it’s considered a bullish signal, past performance doesn’t guarantee future results and traders shouldn’t assume their position will profit from this candlestick alone.
The three white soldiers pattern presents some challenges for traders.
Firstly, the pattern requires a great deal of patience. It’s tough to buy stocks after they’ve had a strong rally—as represented by three green candles in this case—because it can be tempting for investors to think that the price has peaked and is about ready for another drop or correction. In simple terms, your buy position gets activated whenever this formation’s highest price is broken. This means you’re buying at a higher rate and must sell for even more in order to make any profit.
Secondly, since the stop loss is placed below the first candle’s low, you should use a wider stop-loss than normal. If your potential profit on a trade is too small (relative to risk), it’s not worth opening that position—even if technically speaking, an entry could have been justified by other factors like trendlines or previous support/resistance lines Some traders may choose to wait for a pullback that has already started — but in the meantime, they run the risk of missing out on an opportunity.
Finally, some traders steer clear of falling- knife stocks altogether. Due to the high risk that they might lose money even if their initial position is correct—or simply because it’s so hard to tell whether a stock will drop or rise from its current price level—many investors avoid trading reversals altogether until after the market has confirmed this shift with numerous other indicators.
Traders who use the three-white-soldiers pattern should look at other technical indicators to confirm that their strategy is valid. For example, many traders use the stochastic oscillator to determine whether a given security has recently been selling off—before they place it into a long position based on this indicator.
Bottom Line
So there you have it: the Three White Soldiers candlestick formation, with our tried and true trading strategy for using it. This is a great example of how you can use technical analysis to predict future price movements, and even better, how you can do so with just a few simple tools. You also need to consider other factors that may affect the market, such as: In summary, this candlestick pattern is an excellent reversal indicator. When used together with other tools, it can give you a more complete picture of the market. However, it is not a stand-alone indicator.
If you’re interested in learning more about technical analysis or want to know how to trade other types of candlestick formations, check out our blog archives!


