Table of Contents
Everything You Need To Know About The Bullish Harami Pattern: A blog covering what the bullish harami pattern is, why we trade them, how to trade them and where you can find examples.
The bullish harami candlestick pattern is a common and useful tool used in the art of Japanese Candlestick Charting. The Bullish Harami Pattern can signal a potential reversal or continuation of a trend and is used by traders focused on swing trading and long term positions.
Not every trader is a master of candlestick pattern recognition. Some traders simply learn the most effective setups, and trade them over and over again. They make money and move on. Many make fortunes this way, but the majority of us need to go a bit further. My goal here is to teach you everything you need to know about the bullish harami pattern without boring you to tears in the process.
Key Takeaways:
- The Bullish Harami is a reversal pattern and suggests the current trend is about to change.
- It consists of two candles: a large red candle followed by a small white candle that opens in the same direction of the prior day’s close.
- The small white candle should be at least 50% or more than half the size of the preceding red candle.
- Understanding the Bullish Harami Chart Pattern can help you make smarter trading decisions as you navigate your way through the markets.
What Is The Bullish Harami Pattern?
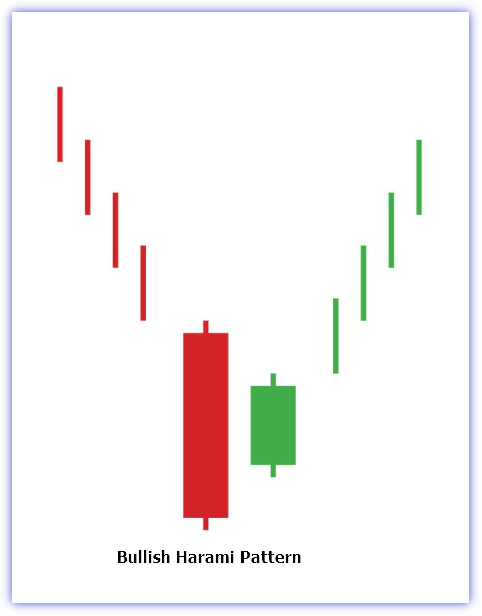
Bullish Harami Candlestick pattern is a reversal pattern that consists of two candles. The first candle is a relatively long and bearish candlestick, while the second candle is a small bullish candlestick that usually has a lower high and higher low compared to the first candle.
The bullish harami is a two-candlestick pattern that appears in a downtrend. It’s a variation of the harami candlestick pattern, which is defined as a candle where the second candle’s body is completely contained within the first candle. In other words, the second candle’s body has to be completely inside the first candle.
The bullish harami consists of two candles: one black and one white. The black candle is the first candle and has a large body (defined as more than one standard deviation). The white second candle has a small body that’s completely contained within the first candle’s body. This creates an image of an inverted mama bear with her cubs — hence, its name.
Bullish Haramis are also known as “pregnant” or “inverted mama bears.”
1st Candle:
The first candle is bearish and tall (at least twice as big as the second). The color of this first candle can be either black or white, but it must be long.
The black or red candle has a large body (defined as more than one standard deviation).
2nd Candle:
The second candle is small (about half as big as the first). This second candle has a lower high and higher low than the first one. Its color must be either green or white.
The white second candle has a small body that’s completely contained within the first candle’s body. This creates an image of an inverted mama bear with her cubs — hence, its name.
Understanding a Bullish Harami
A bullish harami, a candlestick chart formation in which the body of the second bar is smaller than that of the first and shadows it completely or partially to its downside, suggests that a bearish trend might be coming to an end. This may prompt some traders or investors who are looking at this pattern as confirmation for entering long positions on an asset’s price to make their move now rather than later.
Candlestick charts, named for the candle-shaped part of the chart where prices are indicated with a line extending from it, reflect changes in security or commodity price over time. A candlestick chart shows the opening and closing prices, as well as high and low values for each stock on a single day.
The bullish harami pattern is considered a reversal signal, suggesting that the previous downtrend will continue. The Japanese candlestick charting technique was developed by a man named Homma Munehisa. It’s based on the ancient art of divination and is still used today in Japan for financial forecasting.
A harami pattern is a form of candlestick charting that allows a trader to predict if the market will go up or down. It’s based on the principle that when two candles appear together in a single chart, they are often telling us something about the future direction of price movement.
A bullish harami is a candlestick pattern that forms when a short-term downtrend reverses and the second day of the pattern is completely contained within the first day. The pattern is bullish because it suggests that the bears have been in control, but there is an opportunity for bulls to take over.
When you see a bullish harami, you should be cautious about entering a long position because it may be an indication of a price reversal. If you do decide to enter a long position, then you should wait for confirmation from another indicator before placing your trade.
The bullish harami can also be used as an entry signal for short trades if there’s been an uptrend followed by a higher high and higher low. However, it should only be used as an entry signal if there’s been significant movement between these two highs and lows; otherwise, it could represent consolidation rather than reversal.
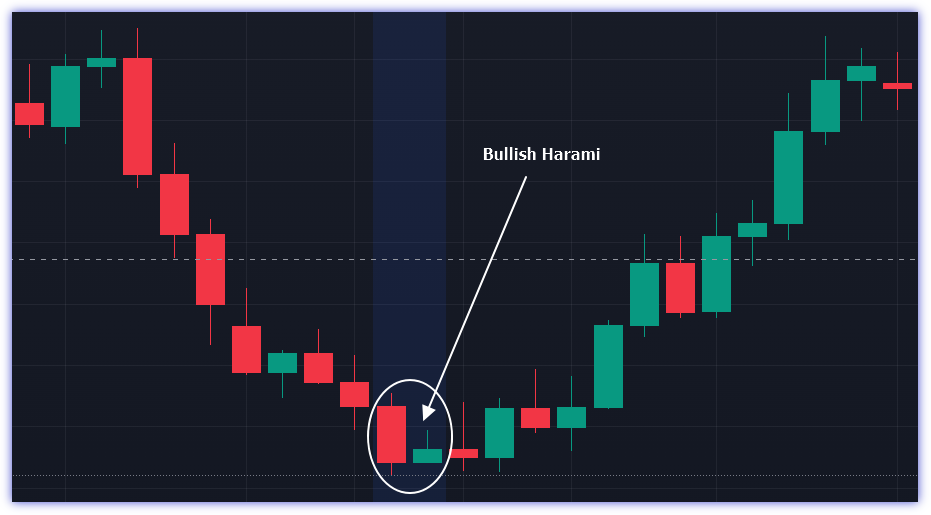
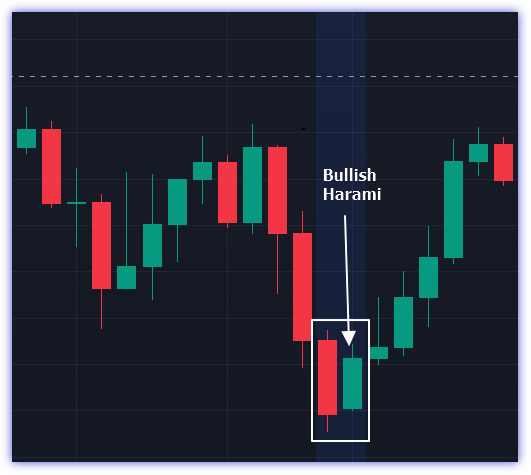
The chart above shows a bullish harami. The first two black candles show that the asset has been trending downward over the past two days, while on Day 3 it slightly moves upward—but not by much as its body is completely contained within the previous candle’s range.
When investors see this bullish harami, they may be encouraged by the diagram’s implication: that a reversal in the market is imminent.
Conditions for the Bullish Harami Candlestick Pattern:
The bullish harami candlestick pattern is a reversal pattern that can be seen in the aftermath of a downtrend.
In order for a bullish harami to occur, there should be:
- There must be a clear downward trend.
- The first candle of the pattern must be bearish.
- The body of the first candle has a minimum of two times the length of the body of the second candle.
- The second candle has a smaller body size than the first candle.
- There is a gap between both candles, and the gap contains no shadows.
- The second candle’s upper shadow is shorter than its lower shadow, and both shadows are contained within the range of price movement between open and close for the first candle.
What does a Bullish Harami Tel Investors?
The Bullish Harami is a reversal candlestick pattern that occurs when the previous candle is bearish and the current candle has a small bullish body. The small body of the current candle must be completely engulfed by the body of the previous candle.
The Bullish Harami is considered to be a bullish signal because it indicates that sellers are exhausted and buyers are gaining strength. Traders often use this pattern as an entry point for buying a security or stock.
In addition to being used as an indicator of market direction, traders also use this pattern to predict how long their position will last before they exit the trade. The size of the second candlestick can help traders determine how long they should hold their position open.
A bullish Harami pattern tells investors that sellers are losing control over market prices and have begun to lose interest in selling at those levels again in the near future; this translates into higher prices for traders willing to buy at those levels now. Conversely, a bearish Harami tells traders that buyers are losing interest in purchasing at those levels; this means lower prices for those willing to sell now.
How to trade Bullish Harami?
When you’re trading, it’s always better to be on the side of the market that’s already winning. When trading with these patterns, remember that they are just one piece of information that helps inform your decision-making process as an investor. It’s important that you keep an open mind when analyzing charts as they can tell many stories depending on how they’re interpreted by each individual person looking at them.”
The candles can be on any time frame, but most traders use them on daily or weekly charts. When this pattern appears in these time frames, it means that there is an increase in volatility within the market; it often signals an impending reversal from bearish to bullish or vice versa.
Here’s how to trade a bullish Harami pattern:
- Look for two candlesticks with the same opening price and different closing prices. The second candle should be smaller than the first and appear within the body of the first candle.
- The more price movement in the second candle, the stronger your signal will be. If there is no movement between the first and second candlestick, this pattern is not valid and should not be traded.
- When you see this pattern on your charts, wait for confirmation before entering a trade—it could take one or two more candles before you see an entry signal that matches these conditions!
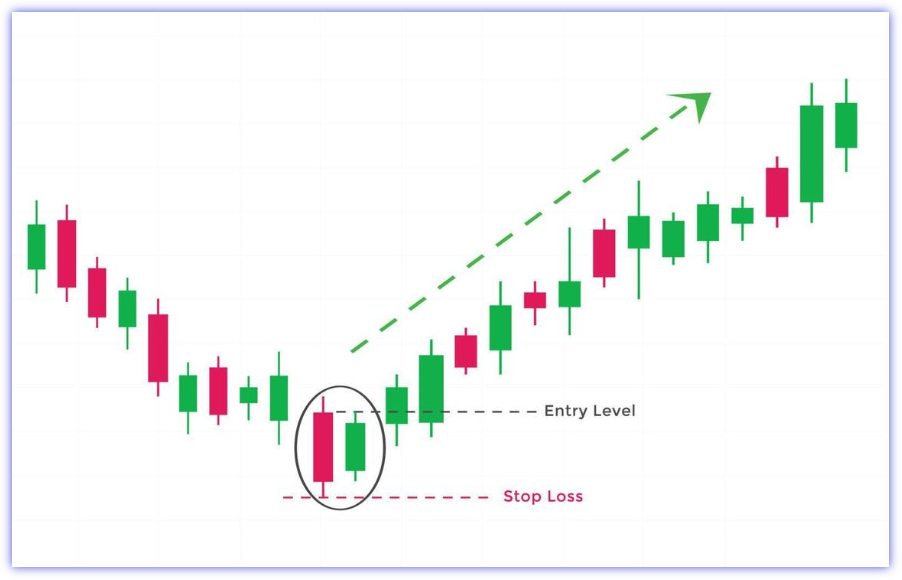
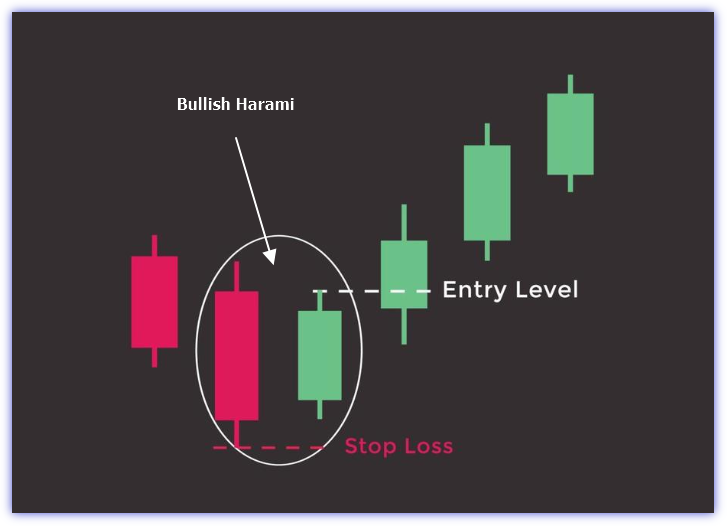
Entry Point: Above the Harami candle high
Stop Loss: Below the previous candle low.
Take Profit: Risk reward ratio should be 1:2
Trade The Bullish Harami Chart Pattern with MACD and RSI
Since the bullish harami is a pattern that can be used to identify reversals in trends, you should confirm that the price has indeed reversed by observing other momentum indicators. The MACD and RSI are the most valuable technical indicators that can help you in this situation.
The chart below includes both RSI and MACD to confirm the reversal.
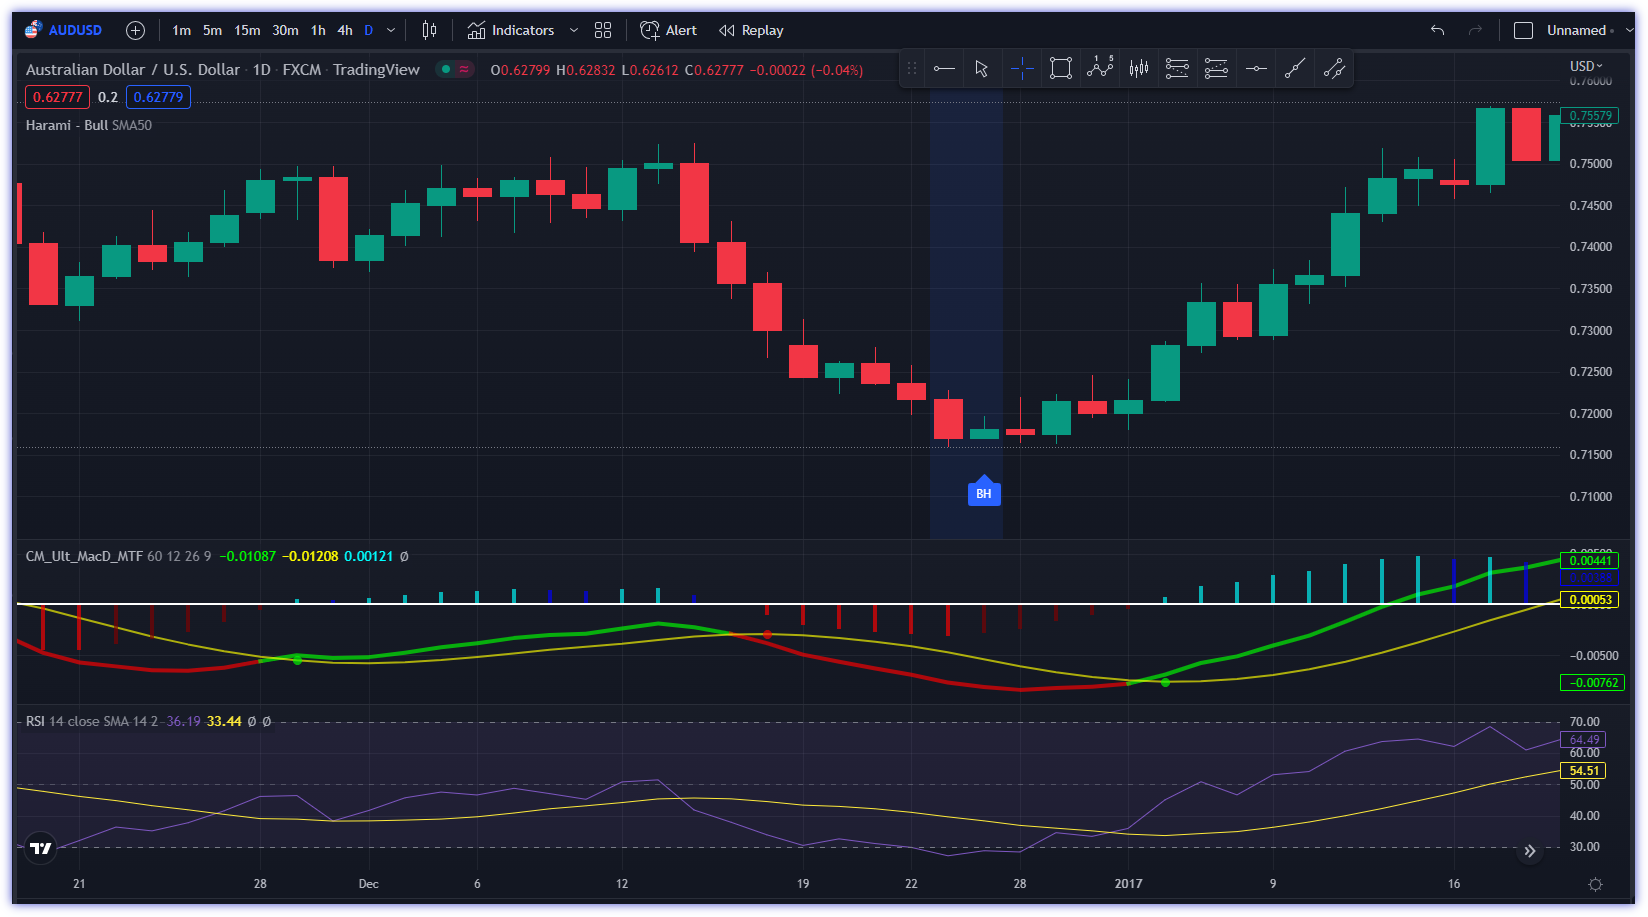
In the AUD/USD Daily chart, you can see that bullish harami and RSI crossover occur at exactly the same time.
The MACD crossover confirms the bullish trend before the pattern occurs, providing strong evidence that momentum is overextended.
Bottom Line
So there you have it! The bullish harami is a powerful chart pattern that can signal the start of a trend in the opposite direction of its preceding trend. It’s a great way to confirm your bullish hunch, so keep an eye out for these patterns when you’re trading.
It’s really not that hard to understand the Bullish Harami chart pattern, so if you want to get started trading with it, we encourage you to get out there and do it!
FAQs.
Why Trade The Bullish Harami Pattern?
The Bullish Harami pattern is a reversal pattern that forms when a small black or bearish candlestick is followed by a doji or small white candlestick that has a lower high and lower low than the previous black or bearish candlestick.
The bullish harami pattern is one of the most reliable reversal patterns in technical analysis, with an accuracy rate of around 70%. This high accuracy rate means that the bullish harami pattern is one of the best indicators of a possible trend reversal, which makes it ideal for traders who want to use technical analysis to predict future price movements.
Because this pattern occurs at the end of an existing trend, it can be used to anticipate future price movements by indicating where they will go next. In particular, if you’re looking for bullish movement after an uptrend, then your best bet is going to be waiting for this pattern before buying any new stocks or currencies because it will tell you when it’s time to buy again!


