Table of Contents
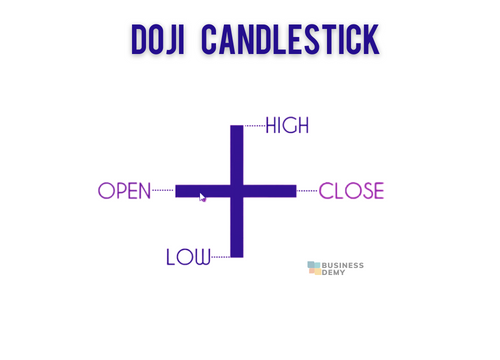
A Doji candlestick pattern is a charting pattern that appears when the Open and Close are equal, and the high and low are almost equal. In other words, it’s a candlestick that has no real direction in price movement, so the open and close are identical.
Doji candlesticks can appear at any time of day, but they’re most common in the morning or evening market hours. They can also appear at any point on a daily or weekly chart—but only if there’s enough data for you to see them!
In general, Doji patterns are an important indicator of indecision within the market: traders aren’t sure whether prices will go up or down from here. That’s why they’re often followed by price action that continues in one direction or another once the Doji pattern is complete!
KEY TAKEAWAYS
- Dōji is used to identify securities price patterns in technical analysis.
- A doji occurs when a stock’s opening and closing prices are very close.
- Doji is a Japanese word that means “the same thing.”
- A doji is a distinctive but infrequent type of candlestick pattern that offers no reliable clues about the direction of a stock’s or currency pair’s price move shortly.
- Three major types of doji formations are the gravestone, long-legged, and dragonfly.
What is a Doji Candlestick Pattern?
A Doji is a candlestick pattern that indicates indecision in the market. It is made up of a short upper shadow and a short lower shadow with no upper or lower wick. The bodies of the candles can be any color.
Most traders consider the Doji to be bearish when it appears near support and bullish when it appears near resistance. However, this is not always true because some traders consider the Doji to be neutral. A trader might consider the Doji signifying indecision when it appears near support or resistance, but also as an indication of trend reversal if it appears just after a trend has been established.
The Doji pattern represents uncertainty among traders about whether prices will rise or fall further in the next few days or weeks. It’s important to note that this uncertainty may be temporary or permanent depending on how long the candles have been forming without moving much in either direction.
What Does a Doji Candle Tell Investors?
The Doji candlestick pattern is one of the most important in technical analysis. It can indicate that a trend is about to reverse or that an existing trend is coming to an end.
The real question is: how do you know when to trade with it?
A Doji candle pattern consists of a long, thin body that gaps away from the previous day’s high and low. The upper and lower shadows are very short, but the body itself is much longer than a normal candlestick. The color of the body can be either white or black, but it doesn’t matter which one it is as long as it’s consistent throughout the chart.
The importance of this pattern is that it shows indecision among traders and investors. This indecision can be interpreted as a lack of conviction about future price movements so it could be used as an indicator of when market sentiment is changing from bullish to bearish (or vice versa).
In order to trade with this pattern effectively in a daily chart, you need to wait until there are two or more consecutive days with dojis on your chart before entering into any positions because they tend not to be reliable until the pattern has been confirmed by at least two consecutive days ( Daily Chart).
Types of Doji Candlestick
There are variations of Doji candlestick patterns, depending on the shadows’ length and position. They include:
- Gravestone Doji
- Long-legged Doji
- Dragonfly Doji
- Neutral Doji
- Double Doji
- Four Price Doji
Doji candles can take many forms but have the same basic shape: a long upper shadow or a long lower shadow and a small body. The question is whether the price closed higher or lower than at the candle’s opening.
Doji Confirmation
A doji on its own does not necessarily indicate an upcoming reversal of the trend. But if there’s already been an established trend and you see a doji form, this may be your confirmation that it is time for prices to move back in the opposite direction.
Dragonfly Doji Candle:
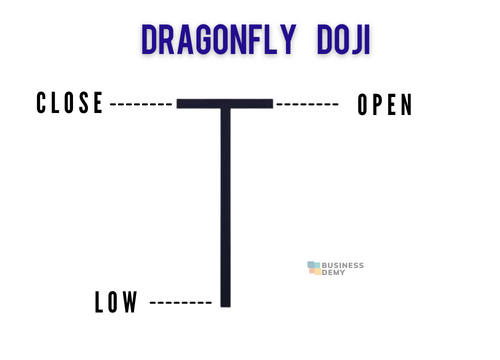
Dragonfly doji candlestick is a Japanese candlestick pattern that can be used to identify potential reversal points in markets. The dragonfly doji candlestick is a reversal pattern that occurs when the price action opens and closes at the same price level, while there is no appreciable difference between both open and close prices.
- A dragonfly doji can appear either after a rise or a fall in the price of the underlying asset.
- Dragonfly doji that appear in an uptrend market signal potential downside. The price must move below the previous candle’s low for confirmation.
- In a downtrend market, a dragonfly doji indicates that prices may rise—and if the next candle does indeed rise, this provides confirmation.
- Dragonfly doji are typically followed by confirmation candles, which traders use as a signal to act.
Example of Dragonfly Doji Candle:
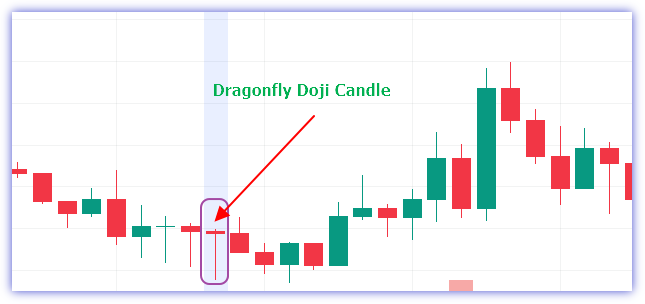
The dragonfly doji candlestick is a simple but effective trading tool that can be used in your strategy. It can provide insight into the market sentiment, and help you decide when to enter or exit a position.
Gravestone Doji Candle
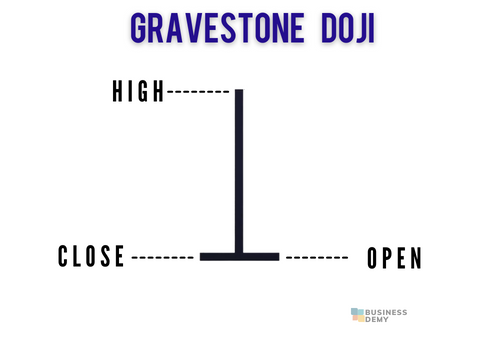
In contrast to the Dragonfly Doji, which has open and close prices at the same level, Gravestone Doji Candlestick have an “inverted T” shape because their opening and closing values coincide with a price low. This suggests that bulls pushed up prices but couldn’t sustain their momentum.
A gravestone doji candle is a candlestick chart pattern that occurs at the end of an uptrend. The pattern indicates that the bulls have run out of steam, their enthusiasm has been exhausted, and the bears are starting to take over..
Example of Gravestone Doji CandleStick:
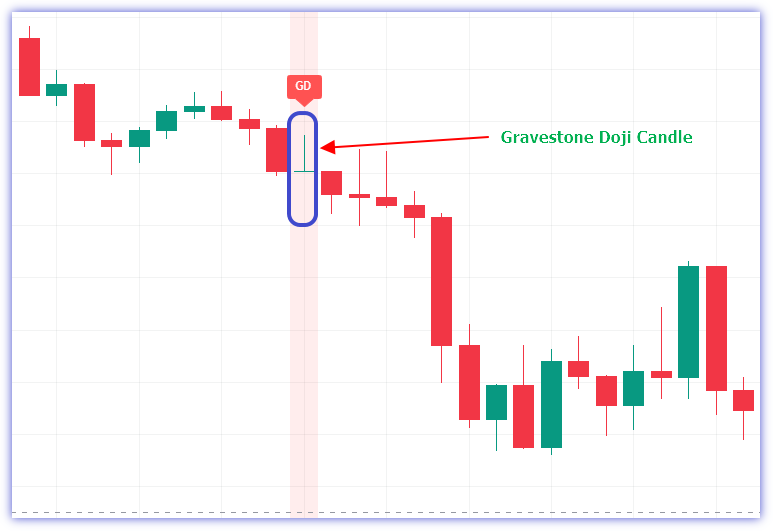
When the Gravestone Doji candle appears during an uptrend, it’s usually a sign of reversal—especially if it occurs near a resistance level. Alternatively, it can be interpreted as bullish when it shows up during a downtrend and hits a critical support level.
Technical stock traders use a pattern of candlesticks known as the gravestone doji candle to predict that a stock price may be ready for a downward reversal. Although many traders use this gravestone doji as a signal for entering short positions or exiting long ones, most will check other indicators before taking action.
Long-legged Doji Candlestick
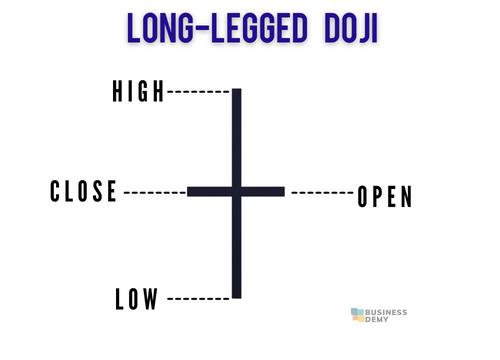
Long-legged Doji candle has long shadows, showing that both buyers and sellers tried to control the price during a given time period. Therefore, it is crucial to monitor the closing price of a candle when the long-legged doji candle forms.
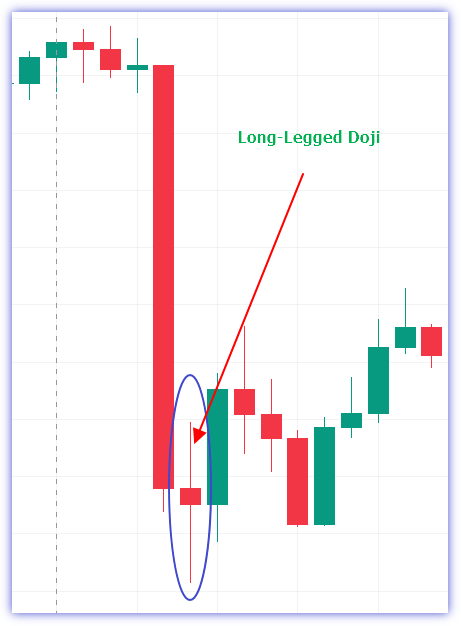
A closing price below the mid-point indicates bearish sentiment near resistance levels; if above, it signals a buy signal—the formation is similar to the bullish pin bar pattern.
When the closing price is in the middle, it can be considered a continuation of that trend. Hence, check its previous candles if you’re looking for confirmation that a security’s uptrend will continue before making an investment decision.
The Neutral Doji Candlestick
The Neutral Doji is a candlestick pattern that indicates indecision in the market. It consists of two long wicks, or shadows, that are approximately equal in length, with a small body in between. The color of the body can be either black or white; however, it is more commonly white.
The color of the wicks and the length of those wicks are what make this candlestick different from other patterns. The long wicks indicate that the buyers and sellers were in agreement for a significant amount of time during the period represented by this candlestick. Since both sides were equally strong, neither side was able to make any significant gains or losses over the course of this period.
This pattern is often found at key areas within an uptrend or downtrend, so investors will often look for it as they make their trading decisions. If they see one at a key support or resistance level, they may choose to wait until there is additional confirmation before entering a trade based on this pattern’s existence alone—but if they do decide to enter based solely on this pattern’s existence alone then they would need to use caution since these patterns can also appear at random times throughout an uptrend or downtrend which could mean that buying or selling into these areas could be a costly mistake. If an investor does decide to enter based solely on this pattern’s existence alone, then he or she would need to use caution since these patterns can also appear at random times throughout an uptrend or downtrend which could mean that buying or selling into these areas could be a costly mistake.
The double Doji Candles
The double Doji pattern consists of two Doji candles, one after the other. It is a reversal pattern that shows indecision in the market and indicates that a trend change may be imminent.
The first Doji candle is followed by another Doji candle, which has a lower high and lower low than the first. The bodies of these candles are not significant when you are trading with this pattern.
In order to identify this pattern, you need to look at the high-low range between these two candles. If it’s within 30% of the previous candle’s range, then it’s considered a valid double Doji pattern.
The significance of this pattern is that it indicates indecision in the market and often marks a reversal from an uptrend to a downtrend or vice versa (depending on where your trade is). This means that if you’re long on an asset and you see this pattern form on your chart, then it may be time to get out before things turn even worse for you!
Four Price Doji Candlestick
A price doji is a candlestick chart pattern that has no shadows. It is a line that appears on the chart with the same opening and closing prices. The upper shadow of the doji may be filled or empty, depending on the time frame being used in your charting software.
The price doji can appear as part of a trend or reversal pattern, but it is most commonly seen at the end of an uptrend or downtrend. This makes sense because it represents indecision among buyers and sellers about where to go next. When traders see a doji in their charts, they will often wait for confirmation before making any trades based on this information.
The four-candle price doji represents indecision among buyers and sellers over whether to continue an uptrend or downtrend. This indecision can last for several days before either side wins out and pushes prices higher or lower than they were before this indecision began.
A Doji Candle and a Spinning Top
Candlestick charts are used to analyze market trends, measure investor sentiment and predict future movements. In addition, patterns in candlestick charts are a way to recognize market action and reaction.
When doji and spinning top candles occur in isolation, they indicate neutral price movement. However, when they surround other candles or form part of a larger pattern like the star formations recognized by technical analysts—they are often seen as preparing to move higher or lower depending on whether the formation is bullish or bearish.
Although doji and spinning tops share some characteristics, there are also significant differences in how technical analysts should interpret them.
Spinning top candles have bodies that are longer than those of doji candles, where the opening and closing prices are relatively close to each other. The body of a candle can make up 5% or less of the entire candle’s range and still be considered a doji. Above that, it looks more like a spinning top.
A doji or spinning top signals weakness in the current trend. However, these formations are not always followed by a reversal—just as spotting them does not guarantee one will occur. Bollinger Bands can help determine whether dojis and spinning tops indicate neutral price action (as seen here) or possibly more significant changes ahead.
How Can a Doji candlestick Be Used in Cryptocurrency Trading?
A doji candlestick pattern is a simple charting tool used by investors to determine the market sentiment of a cryptocurrency asset. A doji pattern is formed when the opening and closing price are equal, or nearly equal, in value, and the high and low prices are very different from one another.
The formation of a doji candlestick pattern can signal investor indecision about a cryptocurrency asset. Investors who are unsure about whether or not to buy or sell may wait for further confirmation before making their decision. When combined with other indicators, such as an increase in volume or an increase in volatility, a doji candlestick pattern can be an important indicator of potential upward or downward movement in price.
Conclusion
And that’s all there is to it. A doji candlestick pattern is a great way to identify potential reversals in the market. If you’re looking for a good way to trade with it, make sure you always look for confirmation from other indicators and do your homework before making any trades.
Good luck!


