
Table of Contents
In financial market, understanding the Elliot wave theory and Elliott wave pattern is the core part of technical analysis. This analysis helps to understand the long-term price actions caused by the investor’s psychology and sentiment.
History of Elliott Wave Theory
There was this guy called Ralph Nelson Elliott, an American accountant. He had always been fascinated by the workings of the market be it a stock market, currency market or anything else. In the early 1930s, Elliott began a systematic study of seventy-five years of stock market data, those data include daily, weekly, monthly, bi-annual data. He started measuring the trend and oscillation through different indexes. He ended up writing a book called The Wave Principle. As per his findings, a market trades in repetitive cycles, he attributed those ups and downs to the outside influences and prevailing mass sentiment or psychology. He named those ups and downs as “waves”.
This finding confirmed a theory of economics which described economic activities as cyclical. However, Mr. Elliott believed that if a trader identifies the repetitive patterns (Elliott Wave pattern) correctly then he or she will be able to predict the future price action correctly. This is what makes the Elliott wave theory very attractive to traders and speculators alike. For gaining a complete understanding of this theory you must understand what is “fractals”.
What is Fractals in Elliott Wave Theory?
As the term suggests, a fraction is a small part of a larger whole. Fractals are no different. Fractals are structures that can be broken into multiple parts. Each and every part is an identical copy of the larger whole. In technical circles, this property is called “self-similarity”. One very crucial aspect of the Elliott Wave Theory is that its constituent parts are self-similar or fractal.
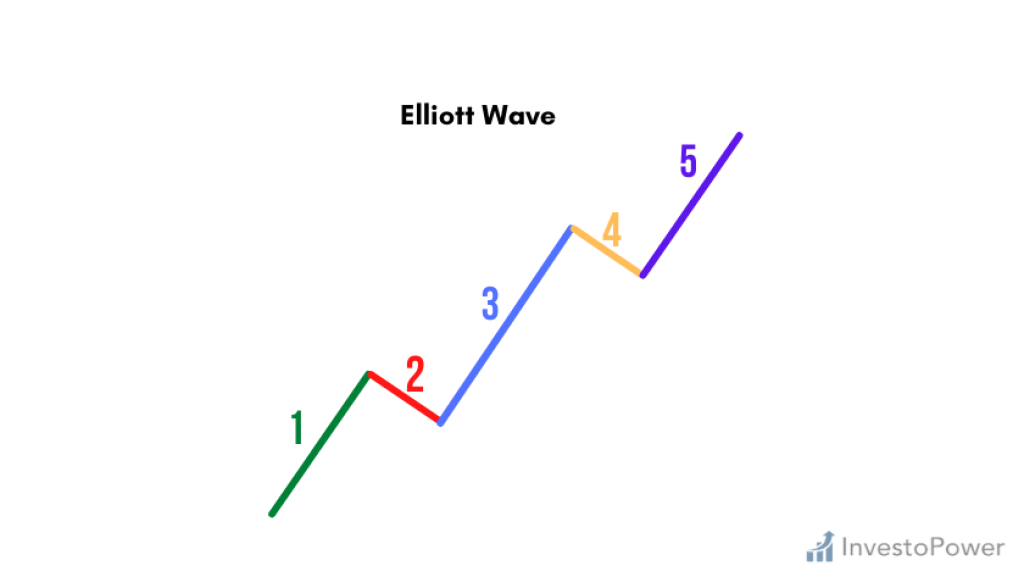
The above graph shows Elliott wave pattern
Elliott Wave-1
Here the price of a currency pair is moving upward. This situation is caused by a smaller number of traders and speculators deciding to purchase the currency pair all of a sudden because they have sensed that the price is lower and it is the proper time to buy.
Elliott Wave-2
This is a point of a bit of “self-reflection”. People who have bought currency pairs have started thinking that the pair is “overvalued”. Some have started selling those currencies and started earning a profit. This has instigated the prices to go down but this time the low will not be as deep as the initial low and with time the prices will start shooting up again.
Elliott Wave-3
This is the longest part of the wave. When we see prices shooting up that high then it is obvious that people will start noticing it. More and more market participants will start buying the currency pair. This triggers the prices to go up and up. And as a result, this ascendance will result in a “high” which is higher than the endpoint of the wave 1.
Elliott Wave-4
This kind of going up will very soon result in a change of mind in some people. Some traders and speculators will start thinking that the currency pair is very expensive at this point. This mindset will be weaker than its preceding wave because there will still be a majority of participants who think that the sentiment is still “bullish” and waiting to go long.
Elliott Wave-5
This is the last stage in the wave. Here the market participants are overtaken by “hysteria”. People have started making their decision based on big news coming out in different print and electronic media. Traders have started basing their buying decisions on ridiculous reasons. This is when a market becomes “overheated”.
Extended Market Impulse Elliott Wave Pattern
A very important thing in studying the Elliott Wave Theory is that one of the constituting impulse waves will be “extended” in most of the events. In other words, there will always be one or two fractal waves that will be longer than the two, irrespective of degree.
Corrective Market Elliott Waves Pattern
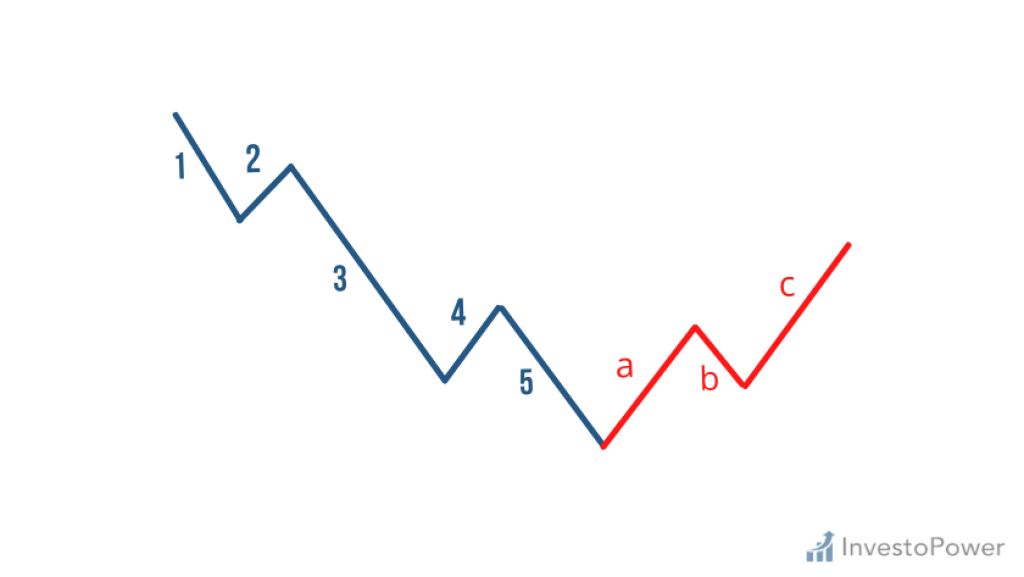
As we all know, the market is driven by sentiment or psychology along with the genuine demand of the respective market participants. Due to the prevailing sentiment, we see the situations where a particular currency becomes “overbought” or “oversold”. The market has a unique mechanism to correct the situation of “overs”. And in Elliott Wave Theory this kind of mechanism is known as “corrective waves”.

In this hypothetical depiction, we are seeing 5 wave trends are corrected by 3 wave counter-trends. We are using letters instead of numbers to clarify the difference. The same graph can be turned upside down to see things in other ways.
Elliott Waves Patterns
Types of Corrective Market Elliott Wave Patterns
As per Mr. Ellott, there are 21 different types of “corrective patterns” which is also known as the ABC pattern in a whole scheme of things. Those types range from “simple” to “complex”. Understanding three different formations like the zig-zag formation, the flat formation, and the triangle formation will help you go a long way in deciphering the situation.
Formation of the Zig-Zag Elliott Waves
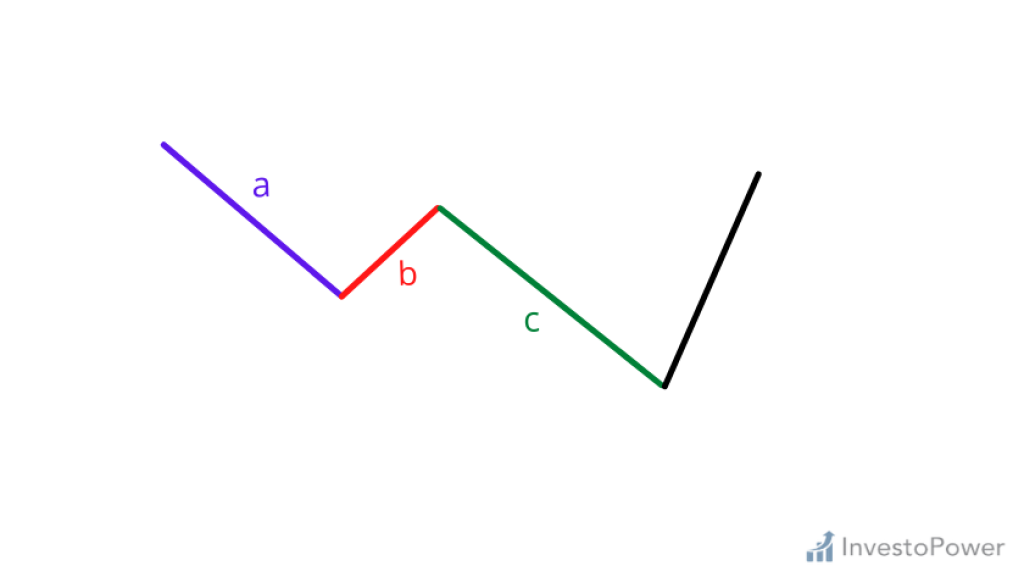
The zig-zag formations are one of the corrective waves in the price of currency pairs that go opposite of the prevailing market trend. These formations are very steep in nature. Here, in the above graph, Wave B is shortest in length compared to the other two: Waves A and C. These zig-zag patterns can form twice or more than that in price correcting situations.
Formation of Flat Elliott Waves
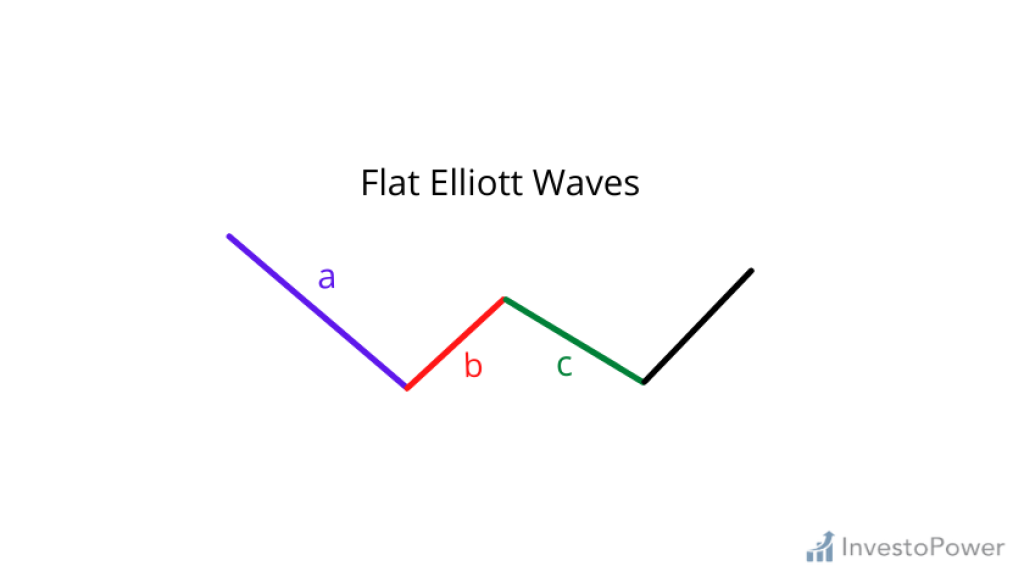
Flat formations, on the other hand, are sideways corrective waves. In this kind of formation, the lengths of the constituting waves are usually similar in length. Here in the above graph, we are seeing that Wave B is canceling out Wave A’s move and Wave C reversing out B’s move.
Formation of Triangle Elliott Waves
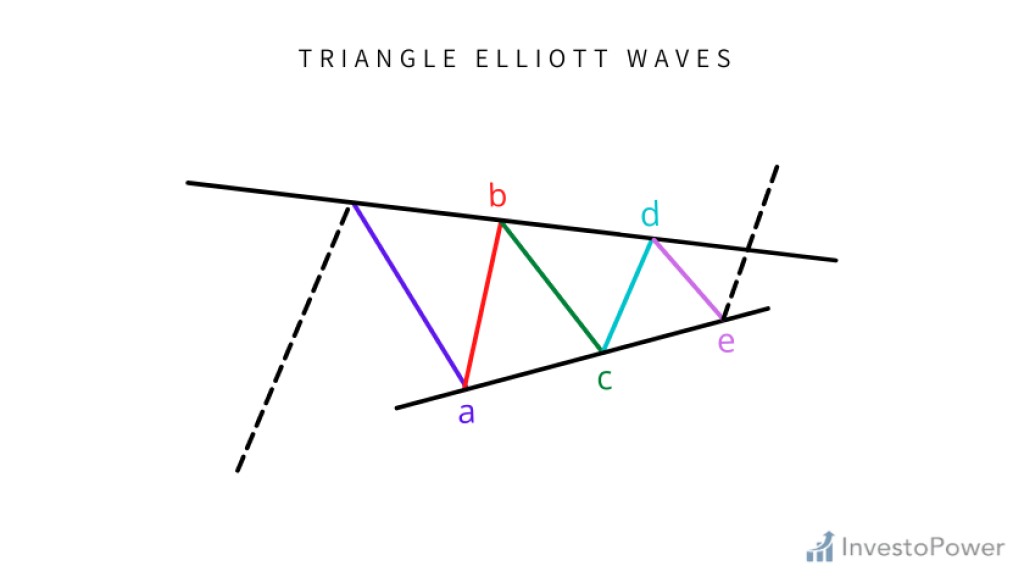
The uniqueness of this formation is that the body of the triangle formation is bound by either “converging” or “diverging” trend lines. A triangle is usually made up of 5 different constituting waves like symmetrical, descending, ascending, or expanding.
Cascaded Elliott Waves
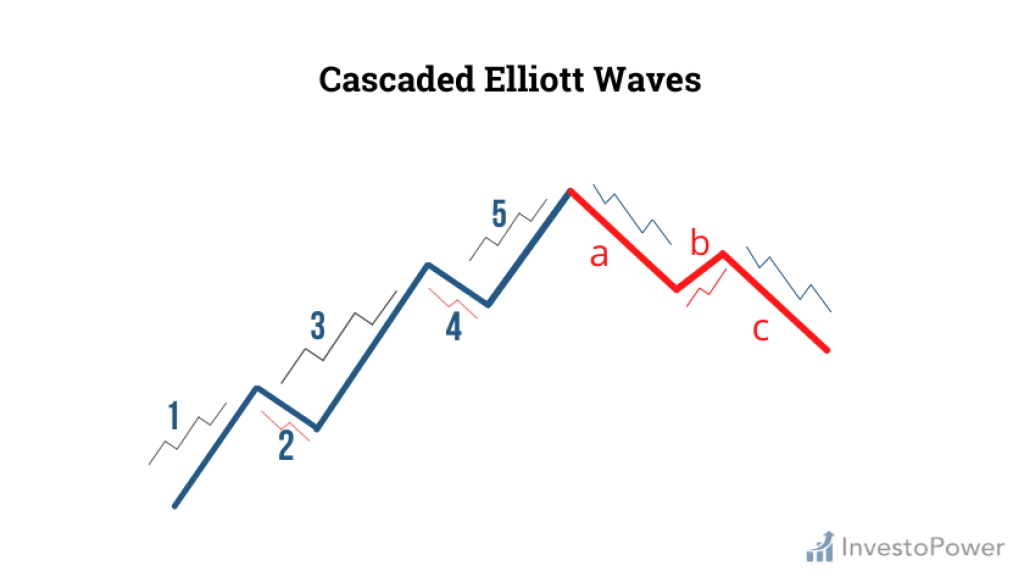
As mentioned before, a larger Elliott wave is made up of multiple smaller waves or “fractals”. In the graph, we are seeing that Waves 1, 3, and 5 are made up of a tiny 5 wave impulse pattern while Waves 2 and 4 are made up of 3 wave correction patterns. Here, you should keep in mind that each and every wave is composed of tiny wave patterns.
Three Basic Properties of the Elliott Wave Theory
As with any other technical analysis tool, the best way to use the Elliott Wave Theory is to get acquainted with the three basic properties of this theory. And those properties are:
- Wave-3 can and must never be the tiniest wave.
- Wave-2 cannot exceed the inception of the Wave-1
- Wave-4 can never go beyond the same price area as Wave-1.
FAQ
Can I use Elliott wave theory in Forex market analysis?
Do all the market follow Elliott wave patterns?


