Table of Contents
What is a triple bottom pattern?
A triple bottom pattern is a visual pattern that shows the buyers (bulls) taking control of the price action from the sellers (bears). It’s characterized by three equal lows bouncing off support followed by the price action breaching resistance.
There’s a reason the triple bottom pattern is considered to be both a bullish chart pattern and an essential element of technical analysis. Its three equal lows followed by a breakout above the resistance level makes it an easy pattern to identify visually. You’ll often hear the triple bottom referred to as an “unbroken pipe” due to its distinctive shape. And that shape can indicate that a stock, commodity, or index is heating up and ready to surge higher. It can also confirm a long-term trend reversal, which signals that the longest losing streak in a stock or index is over, and it’s time to buy. The fact that the three lows in a triple bottom are roughly equal shows that demand during these periods was relatively steady and consistent (the bulls were able to consistently overcome the bears’ attempts to push prices lower).
KEY TAKEAWAYS
- A triple bottom is created by the price of a stock finding its way back down to a support level three times after it has bounced off that level.
- The triple bottom pattern is considered to be a sign that the bear market has ended, and it signifies an opportunity for investors to enter into bullish positions.
-
As a technical analysis tool, the triple bottom chart allows investors to study and examine stock patterns in order to better understand market trends.
- The Triple Bottom Chart Pattern could be a great time to buy your favorite stocks.
Why is the triple bottom pattern important?
- If you are a stock trader, you know the importance of a triple-bottom pattern. Though not many traders like to talk much about this risky trade, it surely pays off quite handsomely if one can correctly spot this setup before the breakout.
- The triple bottom pattern is important because it is a further indication that the market is moving in one consistent direction. This pattern confirms the continuation of market movement with a higher probability of accuracy.
- A triple bottom is a reversal pattern, meaning that it is a signal of change in the current direction of a market or trend. It is one of the three major reversal patterns (along with a double bottom and head and shoulders, which are both reversal patterns as well). This pattern is made up of three distinct troughs, usually at similar lows, and represents a repeated area of demand.
- The triple bottom pattern occurs for a reason. It is a signal to investors that the market may be ready to move up again and does not want to sit sideways for long. It signals the last retracement in the bear market and typically marks the beginning of an intermediate-term trend reversal. In other words, the stock should stage a durable move upward following this chart pattern.
- The triple bottom pattern is considered by many options traders as an excellent indicator of support. This pattern resembles a letter “W” with three equal lows in a down-trending market. The first low occurred at the beginning of the downtrend, and the second and third lows occurred in succession at approximately the same price level.
- The pattern can be used as a reversal or continuation indicator, but it’s most widely used as a reversal pattern.
How to Identify a Triple Bottom Chart Pattern?
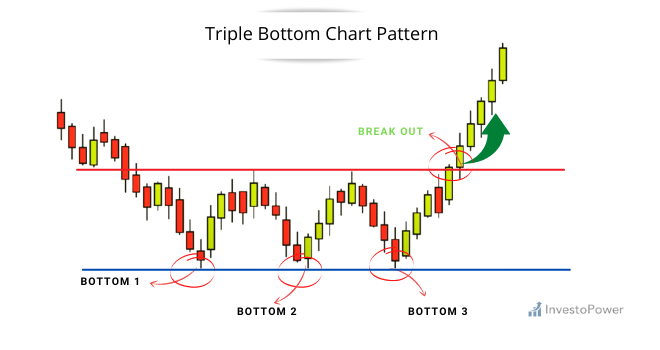
A triple bottom chart pattern is a type of reversal chart pattern that’s formed when a stock falls to a new low and then bounces off the same low point three times. This type of pattern is more reliable than other reversal chart patterns because it signals that the selling pressure has been exhausted and buyers are willing to step in.
We are going to take a look at a trading system for stocks in the financial sector. This system is based on 3 specific patterns created by the interaction of support, resistance, and trendlines located in the monthly price series. These patterns are called triple bottoms. They resemble three consecutive impulse waves separated by two reaction waves, i.e., a triple bottom pattern as shown below:
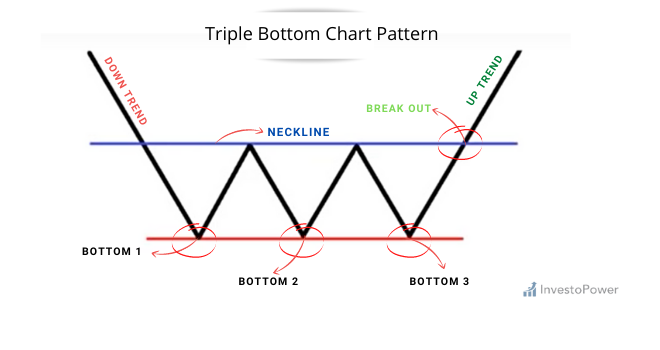
The Triple Bottom chart pattern consists of three distinct troughs that are traced by the price movement of a trend rising from a base. Bottom 1, when taken on its own merits, is a correction wave, and is generally regarded as corrective in nature. The bottom 2 can be considered a wave of consolidation, and the Bottom 3 is the main trend wave.
When looking at a triple bottom chart pattern, you want to see that each bounce occurs at roughly the same price level. The first bounce should go up approximately 50%, while the second bounce should go up approximately 33% from the first bounce, and the third bounce should go up approximately 20% from the second bounce.
In addition to these criteria, there are some other factors you can look for in order to help determine whether or not this is truly a triple bottom pattern:
1.) The distance between each low point should be about equal (or very close). If one low point is significantly lower than another, then it could indicate that either someone was trying to manipulate prices or there was some sort of error in data collection.
2.) If there’s only one high point between two lows, then this pattern may not be valid; however, if there are two or more high points between two lows, then this is not an issue
Spotting the Triple Bottom Chart Pattern
Looking for two consecutive bottoms, both of which are at least halfway down the price chart? If so, it’s time to mark a Double Bottom! Once you’ve found at least two of them, it’s time to draw the neckline.
The third time’s a charm – or at least that’s often the case when triple bottoms appear on charts. This three-step chart pattern marks a breakout following two failed attempts to break the same support level. If the stock manages to close above the neckline after this final decline, then it is a reliable buy signal.
How to Trade The Triple Bottom Pattern?
The triple bottom chart pattern is a technical analysis pattern that can be used to predict whether or not a stock will increase in value.
The triple bottom pattern consists of three consecutive lows followed by a higher high, which indicates that the price of the stock will rise. The pattern is considered complete when the price breaks above the highest low of the three consecutive lows, showing that the price has reached its maximum value.
To trade this pattern, you must wait for confirmation before entering your trade. When using this method to make trading decisions, you should wait until the price breaks above its highest low before entering your trade. Once confirmed, place your stop loss at approximately one-third to one-fourth of your position size (a higher percentage if you’re trading an options contract).
In order to trade a triple bottom chart pattern, you need to:
- Identify the pattern and make sure it is in a bullish direction
- Wait for confirmation of the pattern by price breaking above the resistance line
- Place an order at or near the resistance line and use a stop-loss order at least 10% below your entry price
The outcome of the Triple Bottom Pattern?
The outcome of a triple bottom pattern is not easy to predict. The pattern could indicate an upward trend or a downtrend. In fact, there are several outcomes that can be derived from this pattern.
The first outcome is when the price breaks above the support line which forms the third bottom of the pattern. This signals a breakout to the upside and indicates a bullish trend for the stock or commodity being analyzed.
The second outcome is when the price breaks below the support line which forms the third bottom of the pattern. This signals a breakdown and indicates a bearish trend for the stock or commodity being analyzed.
Another outcome is when there is no breakout at all after three bottoms have been formed in succession on a chart. There are many reasons why this could happen, but most often it happens because there isn’t enough momentum behind this move to push prices through resistance levels set by prior highs or lows on an up-trending chart (or vice versa). This lack of momentum may mean that it’s better to wait until something more substantial like a breakout occurs before entering into any positions on this setup as it may simply be too early in its formation for us to determine whether it will become profitable or not.
If you do decide to trade this setup, then the first thing that you should do is set a stop loss order below the last low formed on the chart before entering into any positions. This will ensure that if the price fails to break through resistance levels set by prior highs or lows and falls back down again
Advantages of triple bottom chart pattern:
The triple bottom pattern can be one of the most accurate forms of technical analysis. Here are some of the advantages:
- The triple bottom pattern is a top trading indicator and has provided many traders with substantial gains in the market for many years. It can be a very effective tool for skilled technical traders. The pattern occurs when there is a reversal pattern in a downtrend, the stock breaks out to new highs, then retreats back to its previous low, producing a triple bottom reversal pattern.
- Triple Bottom Patterns are the best chart pattern in forex trading. They work in all time frames and every currency pair. The basic idea is to wait for three touches of price support or resistance level. This presentation will show you how to identify these patterns, trade them, and manage your risk using a trailing stop.
- The Triple Bottom pattern is one of the most powerful chart patterns. It can signal market bottoms, tops, and major reversals. For pattern traders, the Triple Bottom pattern can mark an entry point, a stop loss point, or an exit point.
- The strength of a triple bottom is that it offers the potential for large gains in a short time.
Disadvantages of triple bottom pattern:
There are some disadvantages to using a triple bottom pattern. It has been seen that in trading where the market is in consolidation a triple bottom can be produced. Although, the market moves up or down sharply after a close below the upper trend line. Then it breaks above this upper trend line but there is little momentum to climb higher. So, traders tend to take no position during this period because they’re not sure about market movement. But if they have waited and looked carefully, they will have seen that the price has started to spiral downwards again.
The Difference Between a Triple Bottom and a Triple Top
- There are many different types of patterns used in technical analysis. One of them is the triple bottom pattern which looks for a stock to break out from a support level that has acted as a kind of “base” or floor for the stock. That being said, there are also things that can be seen in the opposite direction where a broken resistance level can act as the lowest price floor, forming a top pattern. The industry uses both terms interchangeably and while they look similar they do have some distinct differences one may want to consider before investing in either type of formation.
- A Triple Bottom pattern occurs when three or more consecutive troughs create a “triangle” shape. It is simply drawn by connecting the troughs with a dashed line, similar to connecting a series of consecutive peaks on a chart. Double Bottom and Triple Bottom patterns are both considered Reversal Patterns and represent alternating periods of gains and losses that form over a period of time rather than in one specific day.
- A triple bottom is a bearish market reversal signal, while a triple top is a bullish signal. Both signal the end of an ongoing trend.
- Triple tops and bottoms are a tricky concept to grasp. It is not enough to know what the setup looks like. You should understand why it is so difficult for prices to move any further either up or down after the formation of the pattern.
Limitations of Triple bottom pattern
The triple bottom pattern is a rare occurrence that may or may not result in a successful trading opportunity. While the risk-reward of the pattern is limited, if the target and stop-loss are placed out of range, there is still a possibility for a large win, though this is also unlikely.
A triple bottom pattern is another example of the risk-reward ratio being heavily weighted towards the reward side of the equation. In order to improve the risk-reward ratio and take advantage of a bigger potential profit, many traders will use a stop loss that is actually inside the triple bottom. The issue here, however, is if the price does break out upward and get above the resistance, then there is a possibility that the pattern could fail and actually become a double bottom or even a head and shoulders pattern.
Bottom Line
Triple bottoms are rare chart patterns but they are not rare reversal patterns. Correctly traded they can be quite rewarding. The pattern is very easily identified and the results tend to be far higher than would be expected. Do note, however, that like all chart patterns it still needs confirmation and that confirmation should come at the very least in the form of a higher high or lower low. That is, do not buy if there is no such confirmation: treat it as a normal continuation pattern, not a reversal pattern.
FAQs
Is a Triple Bottom Bullish or Bearish?
A triple bottom is a bullish pattern. It’s a signal that the market has reached a low point and is preparing to move upward again. The three bottoms signal that the market has found its footing and is ready to move upward again.
Is a Triple Top Pattern a Good Sign?
Yes, it is. Triple Top Patterns are a vital sign that the market is about to move in the opposite direction.
A triple top pattern is a good sign if it occurs at the end of an upward trend. It shows that the stock has reached its highest point, and then began to decline again. This often indicates that a bear market may be starting.
Where to find this pattern?
The Triple Bottom Chart Pattern is a bullish reversal pattern that can be found in the long-term time frame because it’s a reversal pattern.
It’s made up of three swing lows that are roughly equal in price. These lows form a base for the pattern. The middle bottom is the lowest point, and the other two represent buying pressure from traders who expect the stock to continue its decline.
In order to confirm this pattern as valid, you’ll need to see a breakout to new highs after the third bottom has been formed. This breakout can occur within hours or days of your last trade, but it should happen soon after confirmation.


