Table of Contents
What is Intermarket Analysis?
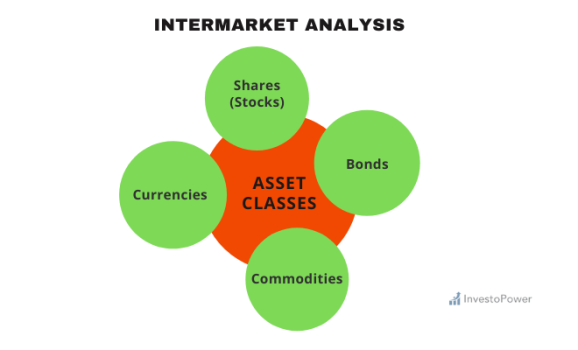
Intermarket analysis is a fundamental and technical analysis for finding out the “correlation” between different markets, or asset classes like bonds, shares (stocks), currencies, and commodities.
Understanding Intermarket Analysis
As no economy operates in a vacuum, so does any market. Each market gets affected by the happenings in the other market also. As a trader, you should keep in mind that whatever is happening in other markets will definitely have an impact on the forex or foreign exchange market also. Since the financial instruments traded in markets like gold, crude oil, and bonds are also considered good “asset classes” to invest in, any change in those markets affects the forex market while the internal dynamics of the foreign exchange market also affect those markets too.
Intermarket analysis is all about finding out the “correlation” between different markets, or asset classes like bonds, shares (stocks), currencies, and commodities. The basic way to approach this kind of analysis is that first you will have to analyze each market or asset class on an individual basis and then you will have to analyze those markets or asset classes that have a strong correlation with the market you are targeting primarily.

For instance, if you are undertaking a study of the US market then it’s worth taking a look at the US bond market, commodity market, and the value of the US dollar. Since commodities are raw materials, any fluctuations or volatility in the commodity front will definitely have an impact on the US capital market and will aid you in determining the future trajectory of the stock market. Intermarket analysis should be taken as a part of fundamental analysis as it depicts the inter-relations between markets and provides a general sense of direction rather than specific figures of pip or profit or loss projection.
Intermarket Analysis Correlations
Doing analysis on an Intermarket basis is very simple and easy. As a trader, all you need is data that is cheap and easily available. You will have to download those, put those into a spreadsheet or charting platforms, and then go for calculating the correlation between them. As per the rules, a value of +1.0 represents a perfect correlation, whereas a value of -1.0 hints at a perfect negative correlation. And if the value comes “0” then it signals that there is no correlation between those assets.
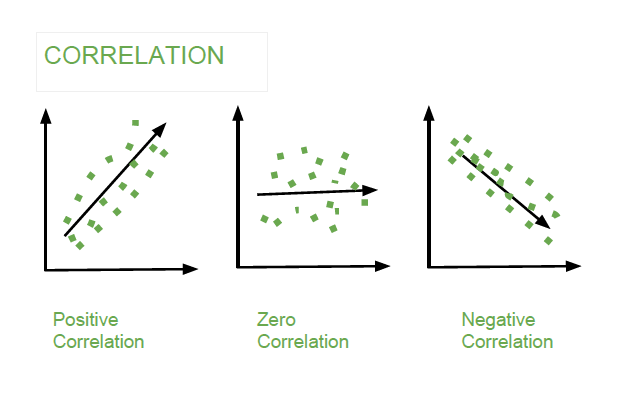
You must keep in mind that a perfect correlation between any two different marketplace or asset classes for a longer period of time is quite rare. But it is a general convention among the specialist circles that any reading sustained above the +0.7 or below the -0.7 level is statistically significant. Whereas, if the correlation changes trajectory and moves from “positive” to “negative” then the relationship would be considered as “unstable”.
As mentioned in different articles, we use Intermarket analysis very often. Most of the time we use it in our subconscious mind like when we discuss the stock prices and the lending rate prevailing in the economy then it is a perfect example of Intermarket analysis. In this case, the analysis says that the relationship is perfectly inverse.
On the other hand, if volatility increases in the currency market due to some external events like the US-China trade war, instability in the Middle East, or war in Ukraine tend to increase fluctuations in the currency market, and then investors and speculators alike start fleeing the forex and start flocking towards safe havens like buying gold. This is another good example of one market getting affected by another in times of uncertainty.
The scope of studying Intermarket analysis correlation is very wide. This article should be taken as a primer on this topic.
Intermarket analysis correlation Between Gold and Currency Market
Trading and investing in gold have been there for centuries. In the past, gold coins were there as a currency, but gradually this practice ceased and people started keeping gold in stock as an investment tool in their portfolios. Gold has an intrinsic value in the minds of its investors. During times of extraordinary uncertainties, gold has come forward as an investment destination of the last resort. And if history is any indicator then this particular type of metal has never let its supporters down. The relationship between AUD/USD, and USD/CHF is discussed below.
Gold and AUD/USD
The precious metal gold and the US dollar or commonly known as “greenback” have a very inverse relationship with each other. When turmoil increases in the global stage and people start looking for some sort of financial stability then investors and speculators alike start flocking towards purchasing gold. The same is true in the opposite situation. When the economy is sound and running on a strong footing then people start investing in USD.
As we all know that the Australian dollar is a commodity currency, meaning the value of AUD gets affected heavily by the commodity industry, especially gold, operating in Australia. Australia is blessed with some of the finest gold mines on earth. The gold nuggets that Australia extracts are bigger than any other found throughout the world. Currently, the country has 66 operating gold mines, including 14 of the world’s largest. Nowadays, Australia is digging around $5 billion worth of gold every year.
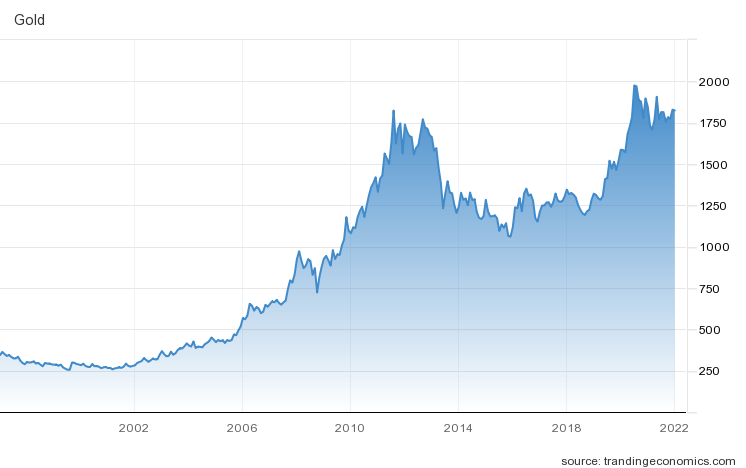
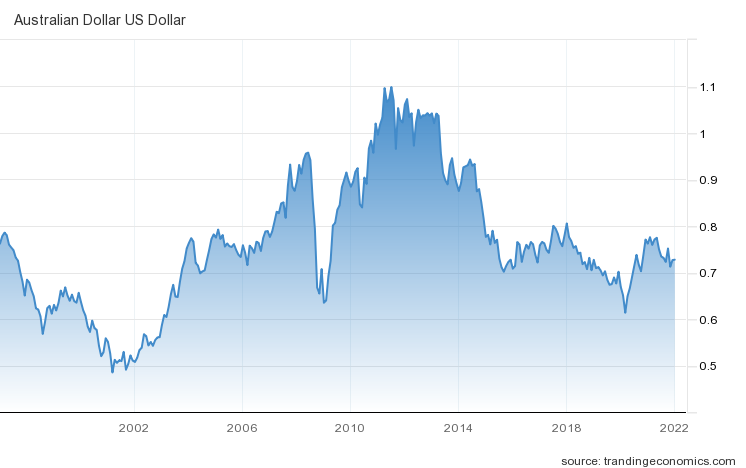
The above chart shows a positive correlation between gold and AUD/USD
As is clear from the above graph, gold has a positive correlation with the pair AUD/USD. When the price of gold increases then the AUD/USD pair tends to go up as well. And when the price of gold decreases then the AUD/USD pair tends to go down as well. Statistically, AUD/USD has a whopping +0.8 level or 80% correlation to the price of gold. It represents the strong relationship that is there between the Australian legal tender and the all-weather safe-haven gold.
Gold and USD/CHF
As we know, the CHF or Swiss Franc is the legal tender of Switzerland and Liechtenstein. It is also used in the Italian exclave of Campione d’Italia. Though Switzerland is a highly advanced economy that relies on its robust financial sector, gold also plays a major role in the Swiss economy. Unlike Australia, Switzerland does not have that many gold mines but the crux of the situation is that most of the gold in the world passes through Switzerland.
Switzerland imports crude gold and adds value by refining it to one of the highest levels of purity. This is a business worth CHF 70-90 billion ($70-90 billion) per annum depending on the global market conditions. The country processes 70% of the total unrefined gold in the world. Most of the gold that reaches the Swiss refinery comes from Britain, the United Arab Emirates (UAE), and Hong Kong. On the other hand, four of the nine major participants in the world gold industry conduct most of their business here in Switzerland.
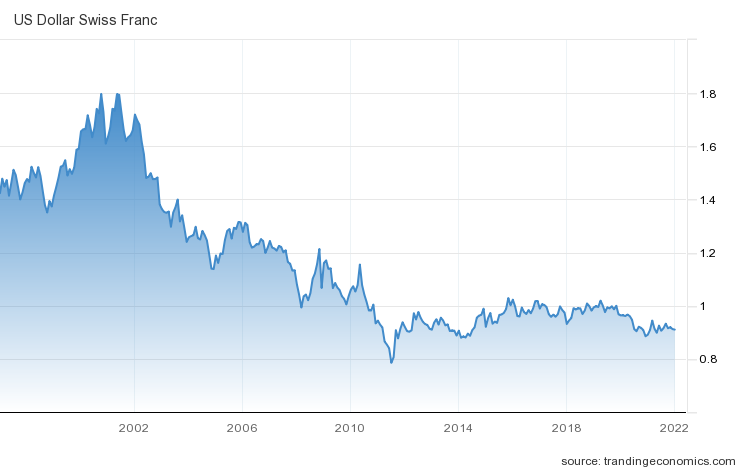
The above graph shows a strong link between gold and USD/CHF.
Gold consists of 63% of the UK’s total exports to Switzerland, the figure is 92% for UAE and 78% for Hong Kong. These are three leading gold exporting countries that do not produce gold in themselves. Switzerland also sources gold from Burkina Faso, Ghana, and Mali, these are countries that depend on gold as their largest exports. Just to give you a sense of how important a role gold plays in the Swiss economy is that during 2017, Switzerland imported 2404 metric tons of gold which were valued at CHF 67 billion. Said differently, 24% of Swiss exports and 31% of imports were directly linked to gold for the year 2017.
Another important aspect you should keep in mind is that as per Swiss laws the authorities should back 25% of currency by gold which keeps the gold high in demand in the Swiss economy. Gold has a negative correlation with the pair USD/CHF. When gold soars in value, USD/CHF goes down. When gold plummets in value, USD/CHF goes up.
Intermarket Correlation Between Oil and USD/CAD
Let’s talk about another very important commodity that is sometimes called the “black gold” and that is crude oil. Unlike gold, the demand for crude oil is there and will be there in the near future. Countries need crude oil to fuel their economies. Oil is needed for producing electricity, running our vehicles, and carrying out production in our factories. So crude oil has a major role to play. Canada is one of the largest oil producers in the world. The country exports 3 million barrels of crude and petroleum products to the United States daily. This makes Canadian economy as the largest supplier of oil to the US. It also makes the Canadian dollar the commodity currency. Due to the huge volume of oil in Canadian exports, the demand for the Canadian dollar or CAD is there.
The above pie chart shows the US crude imports by country
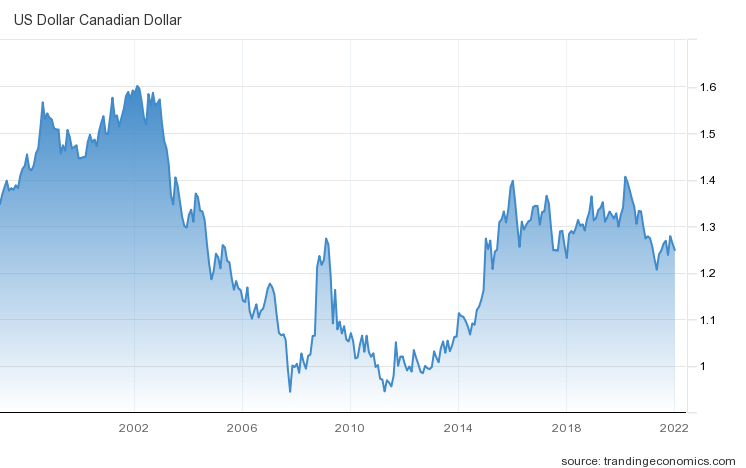
As is evident, the basics of the economy and its internal dynamics affect the value of the Canadian dollar and its relationship with the USD in a very important way. The Canadian economy is highly dependent on exports. The country exports 85% of its goods and services to its southern neighbor the United States of America (USA). Because of this delicate nature of trade with the US, USD/CAD can be greatly affected by how U.S. consumers react to changes in oil prices.
If the demand in the US rises, manufacturers will need to import more oil to keep up with the soaring demand. This will lead to a rise in oil prices, which might lead to a downturn in USD/CAD. If U.S. demand goes down, manufacturers may opt for going slow. Demand for oil might go downwards, which could negatively affect demand for the CAD. Oil has a negative correlation with USD/CAD. As per statistics, during the period between 2000 through 2016 the prices of oil and USD/CAD have shown a 93% negative correlation. When oil goes up, USD/CAD goes down. When oil goes down, USD/CAD goes up.
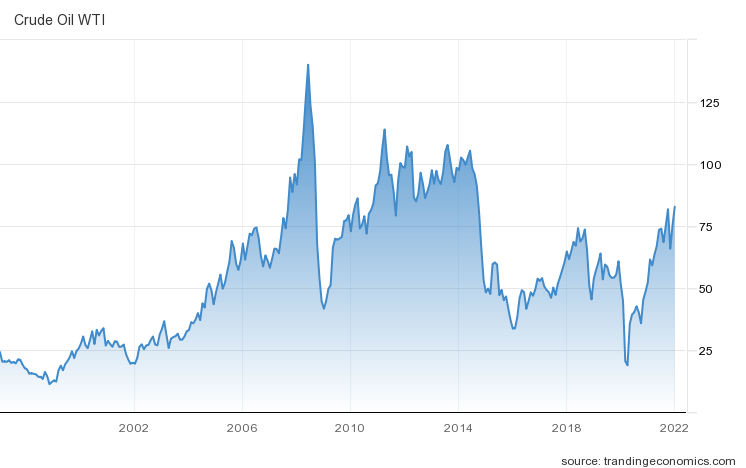
Changing Relationship between Oil and US Dollar
Historically, Intermarket analysis tells the price of crude oil is negatively correlated to the US dollar or USD. This happens due to two main factors and those are:
- Oil is priced in the US dollar;
- The United States has been a net importer of oil historically.
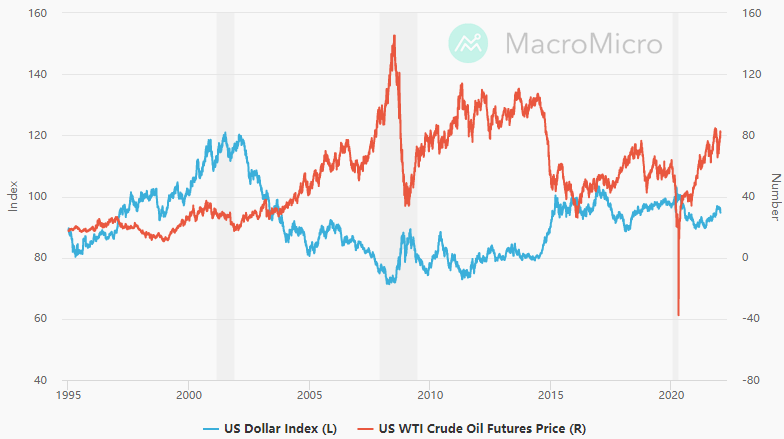
The first reason is still true and affects the relationship very strongly. When the USD is rising in value than one will need fewer greenbacks to buy a single barrel of crude oil. Whereas when the USD is going weak then one will need more dollars to buy a barrel of oil. The second reason is not that strong nowadays. Historically the United States has been a net importer of crude oil. You must keep in mind that the US economy is the top economy in the world and the US needs crude to fuel it. This makes the rising oil prices make the US trade deficit rise as well and vice versa.
It was only in 2011, that the US became a net exporter of refined petroleum products. According to a press release by the Energy Information and Administration (EIA), the United States is now about 90% self-sufficient in total energy production. The technological breakthrough of fracking has disrupted the status quo in the oil market which made the U.S. increase its oil exports while decreasing the crude imports. This means that higher oil prices no longer contribute to a higher U.S. trade deficit, and actually help to reverse the situation. In the end, the statistically strong inverse relationship between oil prices and the USD is becoming more unstable.
Bond Yields and Currency Movements
Bonds are long-term debt instruments. This class of financial assets is also known as “fixed-income securities”. Under this arrangement, the issuer of a bond collects money from the buyers. The issuer promises to pay interest on this loan, also known as a bond yield, and repay the principal amount at a mentioned maturity date. Bonds have some characteristics which are peculiar to them like the interest payments and the principal repayment for a bond are well specified at the time of bond issuance and fixed for the lifetime of the said bond. A typical bond matures on the stated date and is called a “term bond”. Most bonds are “coupon bonds”, meaning the issuer of those bonds pays interest in the form of coupons. Bonds come in many forms like US federal government securities, government agency securities, municipal bonds, and corporate bonds.
As a trader, you should keep in mind that the core of the bond valuation is the prevailing interest rate in the economy. And this is what makes those bonds more or less attractive to the eye of an investor. Since Intermarket dynamics are always in play, any change in the interest rate outlook will have severe repercussions for this market.
For instance, if people perceive that volatility in the currency market is increasing then they will start looking for alternative avenues of investment. An avenue that will give them a sense of security during times of trouble and wild fluctuations. Naturally, they will go for investing in safe-haven financial instruments and bond is one of those. All you need is to put your money in a bond and wait for the maturity period to arrive to cash out. Bonds will definitely yield a fixed risk-free income which will save you from the trouble of investing in the forex market.
So here the golden rule to remember is that if the volatility in the currency market increases then market participants start going after the fixed security markets like bonds. Whereas when times are still and full of certainty on the economic front then people will invest in the currency market to take home the dividend of a growing economy.
Bond Spread and Exchange Rate
As mentioned in another article, the spread means differences in financial parlance. The yield that a particular country’s bond gave compared to other countries is called the “bond spread” and this is what triggers the “carry trade”. By observing the bond spreads and expectations for the interest rate changes, you will have a clear picture in your mind about where the currency prices are heading.
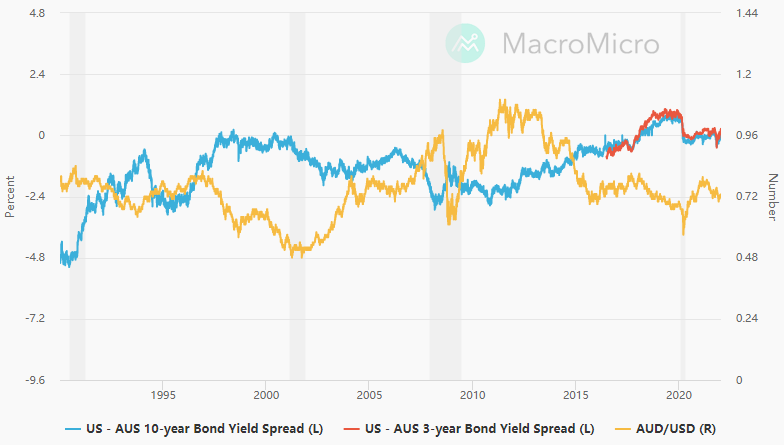
The graph shows the price action of AUS/USD and the bond spread between Australian and US bonds from 1990 to 2022.
If you look carefully at the above graph then you will see that when the spread of bonds between the Australian and US 10-year government bonds increased from 0.50% to 1.00% from 2002 to 2004, the AUD/USD rose around 50%, rising from .5000 to 0.7000. The same pattern was repeated in 2007, this time the differential rose from 1.00% to 2.50%, and the AUD/USD increased from 0.7000 to just above 0.9000. 2,000 pips in total. Here the golden rule to remember is that, As the bond spread between two countries widens, the currency of the country with the higher bond yield soars against the other currency of the country with the lower bond yield.


