Table of Contents
In Commodity Market, Commodities are raw materials. As natural resources, they are used in all sorts of manufacturing processes. From the wood in our dining table to the

cereals in our breakfast, everything has a part of it in it. Hence, commodities acquire a central position in our economic cycle. The ongoing trajectory of the current state of globalization along with the very unique characteristics of commodities make this class of asset, something which can add value to our investment portfolio.
Global Situation of Commodity Market
The current twenty-first century is the century of abrupt and decisive change in the trends and patterns in the global level of commodity prices. During the last century, prices of natural resources fell by a little above a half percent a year on average. But since the dawn of the current century, commodity prices all over the globe have been shown to have doubled in value on average. It also came with a downside. The average volatility of prices has increased to a level where the last 15 years have seen a level of volatility which is three times that of the 1990s.
The new era of constantly rising and volatile resource or commodity prices is being characterized as an era of resource price “supercycle”. Since resource prices have slowed down a bit from their peak in 2011, many have started speculating an end to the “supercycle” era. Despite the fact, even after the recent decline, on average resource prices are at their of 2006-08 level, when the climate for the Great Recession was slowly building up.
The prices of crude oil internationally from 1988 to 2004 used to hover around a range of US$9-$40. Since then it has come a long way and championed the peak of US$30-$148. Even since the Great Financial Crisis of 2008, the average value of US$125 has been tested on several occasions.
The instrument through which commodities are traded in the market is known as “commodity futures”. This financial instrument allows an investor to trade directly the wholesale price of a multiple variety of everyday commodities. Despite being there for hundreds of years, commodity futures are a relatively little-known asset class. The main reason for that may be that commodities are strikingly different from other widely known and invested asset classes like stock, bonds, and other traditional assets.
Besides, due to its high volatility, the marketing tactics of this asset to the general populace have been widely regulated, a policy which has left only high net worth investors and professional traders as the only set of people going after this asset. The main features of the “commodity futures” are:
- Commodity futures are derivative securities as opposed to the stocks which are claims on profit and assets of long-lived corporations;
- They are short duration maturity claims on real assets;
- The majority of commodities have seasonality issues in price levels which are not there on other typical financial instruments.
For example, in stock, the investor receives the right to the future profitability of a corporation and assets after all the claims have been met. Shares are long-term investments which from time to time get affected by the fluctuations in a company’s profit, which in turn depends on the general economic situation of the country.
Commodity futures, on the other hand, do not raise funds for corporations to invest. Rather, commodity futures allow firms to secure insurance for the future value of their outputs (or inputs). Investors in commodity futures receive compensation for bearing the short-term risk of commodity price volatility.
It must be noted that commodity futures do not mean a direct purchase or sale of commodities, rather it means futures prices represent speculation on the expected future spot value of the given commodity. Issues like current and future level of inventory, demand, and supply situation of the said commodity, global or regional conflict, drought, flood, unfavorable weather conditions are the factors that have the most bearing on the value of the commodity or commodity futures.
Major Classification of Commodity Market
Commodity markets are broadly categorized into two different classes. One is a “hard commodity” like steel, copper, tin, and the second one is called a “soft commodity” agricultural produce like rice, wheat, corn, coffee, tea, cocoa are the population of this category. This is also known as a “perishable commodity”, due to its being perishable in a very short period.
Commodities can broadly be classified into six different classes.
| Types of Commodities | Lists of Commodities |
|---|---|
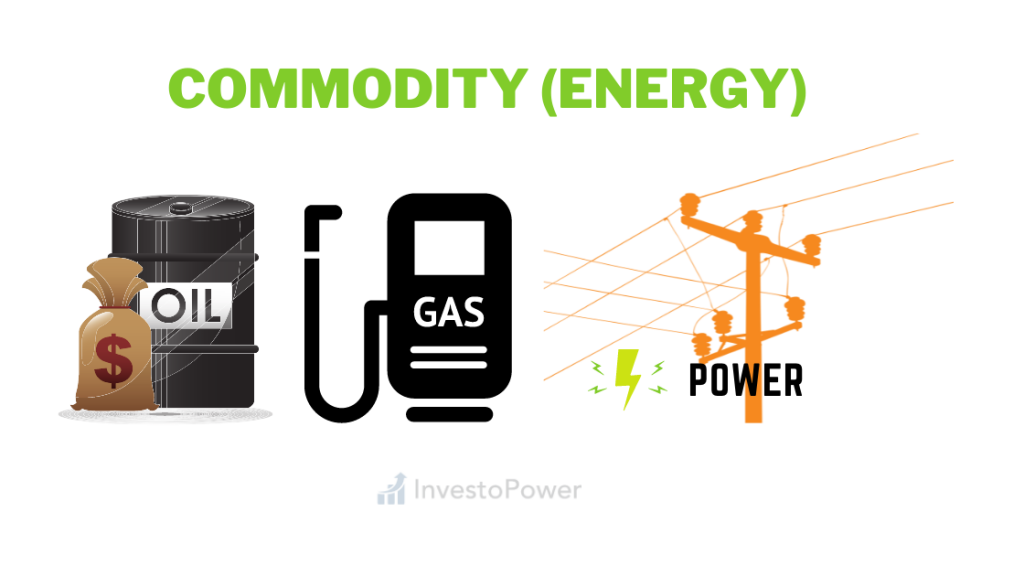
| Energy | Crude oil, natural gas, gasoline, power (electricity) |
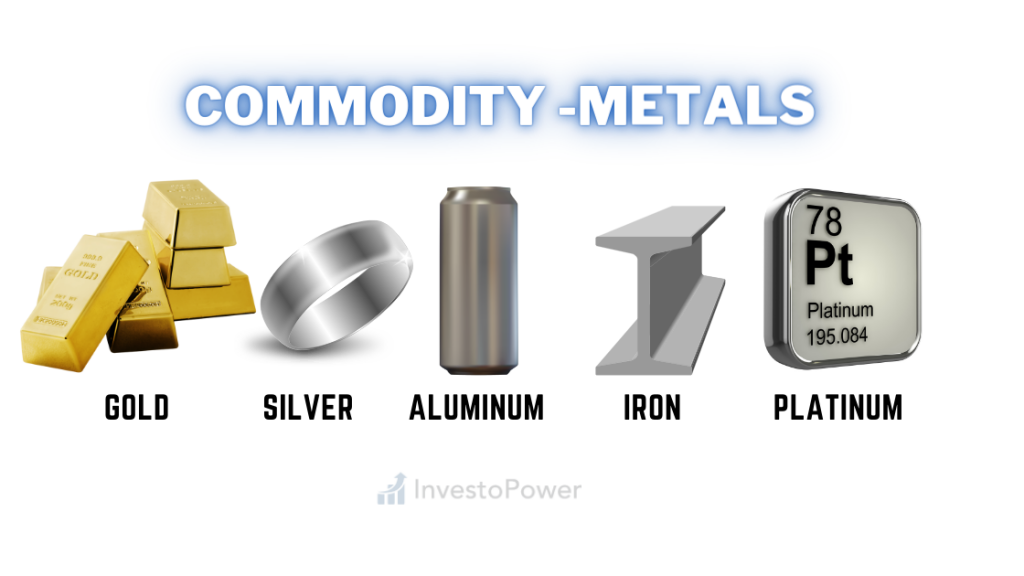
| Precious Metals | Gold, silver, platinum, palladium |
| Base Metals | Aluminium, copper, nickel |
| Ferrous Metals | Steel, iron ore |
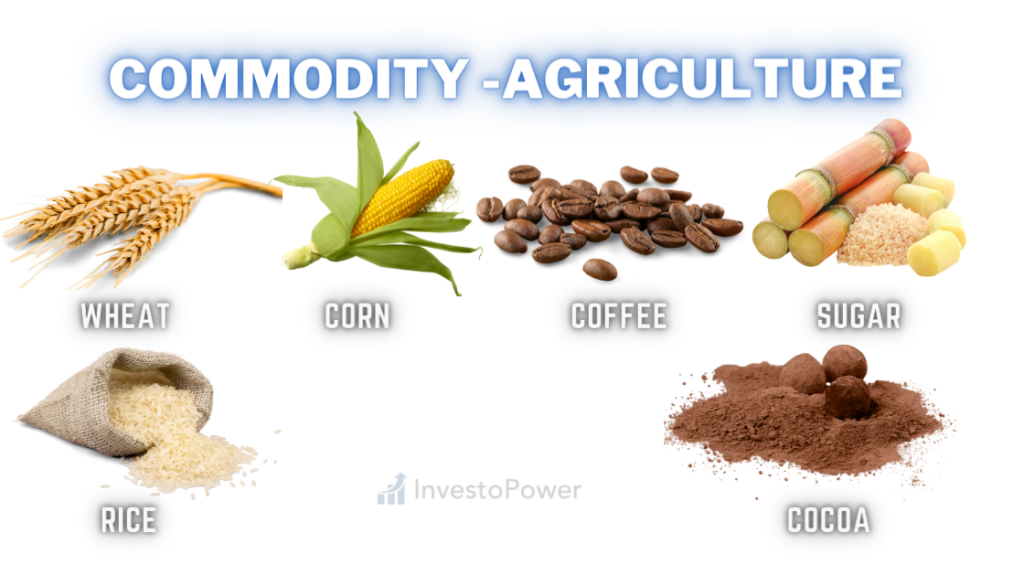
| Agricultural | Wheat, rice, corn, coffee, tea, cocoa, sugar |
| Livestock | Feeder cattle, live cattle, buffalo |
The role of the hard commodities or natural resources is that they are required to kick start the economy which in turn fuels the demand for other groups of commodities. The huge increase in global population, good economic performance all over the world, increasing urbanization, and rising living standards are the ongoing trends that influence the commodity market. Big producers like mining companies or any other large producers try to meet the demand, their output depends on their access to the given commodity and the smooth functioning of that product’s supply chain.
Investment in Commodity Market
The recent commodity boom has generated a number of different instruments to invest in the commodity/resources market. Besides, the proliferation of different commodity-related hedge fund industries is allowing investors entry to a variety of interesting new commodity markets and strategies. This hedging industry is also known as “alternative investment”.
Nowadays, along with big corporations, and professional investors, ordinary private traders are increasingly showing interest in investing in commodities to diversify their investment portfolio. And the reasons are:
- Commodities offer diversification and good risk management;
- The connection between the economic cycle, commodities, and inflation means investing in real assets offers some protection from income eroding power of inflation;
- Despite price volatility, commodities can offer considerable returns from time to time.
Investors must understand that the price volatility in the commodity market which affects the return is being perceived on the high side. Meaning a good chance of earning hefty profit while making significant losses during times of uncertainty.
Quick Overview of Main Commodity Market Segments
The commodity market is driven by factors that are applicable to the markets in general. Besides, it also has some influencing factors which are unique to it which contribute to its being very volatile. Here some of the major commodity markets and prevailing trends are discussed below.
Energy as Commodity
The energy market is very much in the center of gravity as we use electricity in everything. Besides, oil is used to power our cars and heaters. Before the 1970s, the energy market was very much stable as both demand and consequent supply increased in tandem. This period also saw some major discoveries like low-cost sources of energy supply, the weak pricing power of energy producers, and improvement in efficiency in converting energy resources to their respective usable forms.

This trend came to an end abruptly due to the Arab-Israeli war as Arab countries imposed an oil embargo which led to the manyfold increase in crude prices which resulted in the biggest wealth transfer in the history of the world. A huge amount of wealth was transferred from western countries to oil-producing nations. Countries like Saudi Arabia, United Arab Emirates, Iraq, Iran, Jordan became part of new riches. After that, the energy prices slid into a long-running downward trend as Organization for Economic Co-operation and Development (OECD) countries started looking for alternative energy sources.
A reduction in demand after the disintegration of the Soviet Union, and a weakening in the bargaining power of producers also contributed to this trend. But due to the rising cost of supply, the US was on terror, civil war in Syria, instability in the Middle East, the prices of energy have been on rising and have risen by 260% since 2000.
Trends like strong demand from emerging economies, more challenging sources of supply, technological advancement, and the incorporation of environmental costs will all shape the evolution of energy prices in the days to come. The role of natural gas in the energy mix is a very significant one to note. Currently, natural gas represents just a little above 12% of the energy index.
Here is the list of traded energy commodities
| Commodity | Main Exchange | Contract Size | Symbol |
|---|---|---|---|
| WTI Crude Oil | NYMEX, ICE | 1000 bbl (42,000 U.S. gal) | CL (NYMEX), WTI (ICE) |
| Brent Crude | ICE | 1000 bbl (42,000 U.S. gal) | B |
| Ethanol | CBOT | 29,000 U.S. gal | AC (Open Auction) ZE (Electronic) |
| Natural gas | NYMEX | 10,000 million BTU | NG |
| Natural gas | ICE | 1,000 therms | NBP |
| Heating Oil | NYMEX | 1000 bbl (42,000 U.S. gal) | HO |
| Gulf Coast Gasoline | NYMEX | 1000 bbl (42,000 U.S. gal) | LR |
| RBOB Gasoline | NYMEX | 1000 bbl (42,000 U.S. gal) | RB |
| Propane | NYMEX | 1000 bbl (42,000 U.S. gal) | PN |
| Purified Terephthalic Acid (PTA) | ZCE | 5 Tons | TA |
Metals as Commodity
Throughout the last century, metal prices fell by 0.2% a year on average. However, variation was noticed in the prices of different metals also. For example, steel prices were flat, aluminum prices declined by 1.6% a year. The main determinants of the trend in the twentieth century were the discovery of low-cost deposits, technological improvements, and an increase in demand.

Since 2000, metal prices have soared by 176% on average. Among the major metals, gold prices have increased the most, driven primarily by people’s perception that during times of uncertainty, gold represents the safe haven in investment. Prices of copper and steel have hiked by 344% and 167% respectively since the early 2000s, largely due to increased demand from China.
Industrial Metals
| Commodity | Contract Size | Currency | Main Exchange | Symbol |
|---|---|---|---|---|
| LME Copper | Metric Ton | USD ($) | London Metal Exchange, New York | HG |
| Lead | Metric Ton | USD ($) | London Metal Exchange | |
| Zinc | Metric Ton | USD ($) | London Metal Exchange | |
| Tin | Metric Ton | USD ($) | London Metal Exchange | |
| Aluminium | Metric Ton | USD ($) | London Metal Exchange, New York | |
| Aluminium alloy | Metric Ton | USD ($) | London Metal Exchange | |
| LME Nickel | Metric Ton | USD ($) | London Metal Exchange | |
| Cobalt | Metric Ton | USD ($) | London Metal Exchange | |
| Molybdenum | Metric Ton | USD ($) | London Metal Exchange |
Precious Metals
| Commodity | Contract Size | Currency | Main Exchange | Symbol |
|---|---|---|---|---|
| Gold | 100 troy ounces | USD ($) | COMEX | GC |
| Platinum | 50 troy ounces | USD ($) | NYMEX | PL |
| Palladium | 100 troy ounces | USD ($) | NYMEX | PA |
| Silver | 5,000 troy ounces | USD ($) | COMEX | SI |
Agriculture Products as Commodity
Despite the rapid increase in food demand, the prices of agricultural produce fell by 1.7% per year on average during the last century. A rapid increase in yield per hectare, improvement in fertilizer quality, efficient capital equipment, and the dissemination of improved farming technology has led to this decrease in food prices.

The opposite trend has been seen since the inception of the current century. The declining pace of yield improvement, rising demand for fuel and feed, supply-side shocks, and decline in buffer stock worldwide have contributed to 120% increase in food prices during the last two decades.
Grains, food and fiber
| Commodity | Main Exchange | MIC | Contract Size | Symbol |
|---|---|---|---|---|
| Corn | CBOT | XCBT | 5000 bu | C/ZC (Electronic) |
| Corn | EURONEXT | 50 tons | EMA | |
| Corn | DCE | XDCE | 10 metric tons | c |
| Oats | CBOT | XCBT | 5000 bu | O/ZO (Electronic) |
| Rough Rice | CBOT | XCBT | 2000 cwt | ZR |
| Soybeans | CBOT | XCBT | 5000 bu | S/ZS (Electronic) |
| No 2. Soybean | DCE | XDCE | 10 metric tons | b |
| Rapeseed | EURONEXT | 50 tons | ECO | |
| Soybean Meal | CBOT | XCBT | 100 short tons | SM/ZM (Electronic) |
| Soy Meal | DCE | XDCE | 10 metric tons | m |
| Soybean Oil | CBOT | XCBT | 60,000 lb | BO/ZL (Electronic) |
| Soybean Oil | DCE | XDCE | 10 metric tons | y |
| Wheat | CBOT | XCBT | 5000 bu | W/ZW (Electronic) |
| Wheat | EURONEXT | 50 tons | EBL | |
| Milk | CME | XCME | 200,000 lbs | DC |
| Cocoa | ICE | IEPA | 10 tons | CC |
| Coffee C | ICE | IEPA | 37,500 lb | KC |
| Cotton No.2 | ICE | IEPA | 50,000 lb | CT |
| Sugar No.11 | ICE | IEPA | 112,000 lb | SB |
| Sugar No.14 | ICE | IEPA | 112,000 lb | SE |
| Frozen Concentrated Orange Juice | ICE | IEPA | 15,000 lbs | FCOJ-A |
| Adzuki bean | OSE | XOSE | 2400 kg | |
| Robusta coffee | ICE | IEPA | 10,000kg |
Livestock and meat
| Commodity | Contract Size | Currency | Main Exchange | Symbol |
|---|---|---|---|---|
| Lean Hogs | 40,000 lb (20 tons) | USD ($) | Chicago Mercantile Exchange | HE |
| Live Cattle | 40,000 lb (20 tons) | USD ($) | Chicago Mercantile Exchange | LE |
| Feeder Cattle | 50,000 lb (25 tons) | USD ($) | Chicago Mercantile Exchange | GF |


