Table of Contents
What is Pattern in a Chart in Forex Market?
The pattern in a Chart in the forex and stock market is very important. As the old saying goes, a picture speaks a thousand words. This is also the case with the charts that we use in the foreign exchange market. . By looking at the charts carefully, you will be able to spot potential “explosions” and make accurate judgments about the possible price action in the near future. In this article, we will discuss some classical chart patterns that have the most bearing on investment decisions that you will be taking as an investor. Here, the aim of discussing those patterns is to pre-empt any big movement before they actually happen so that as an investor you can take advantage of the situation and take your positions accordingly. Chart patterns are important in the sense that they indicate whether the price will continue in its current trajectory or will take a turn. Analyzing the pattern in a chart will help you identify the following answers:
- Finding a potential entry point in an upward or downward trend
- Finding a potential support and resistance points in chart
- Speculate the future price and possible price actions
- Deciding the right time to get out from the ongoing trade
Basic Patterns to Draw in a Chart
The patterns in a chart that we will be covering in this article are
- Double top and double bottom,
- Head and shoulders and inverse head and shoulders,
- Rising and falling wedges.
Reversal Patterns: Double Tops and Double Bottoms
Double Top Candlestick Patterns:
The way mountains have tops or peaks so does the pattern in a chart. In a mountain range when we see multiple tops then it is quite natural to see those tops being followed by a downward trajectory and a descending line. Multiple tops or to be specific “double tops” are quite common in chart patterns. A double top is basically a “reversal pattern” that is formed after there is an extended move upwards. Those tops look like mountain peaks. After reaching the tops, the price will retreat slightly and then will make a move upwards to test that level again.
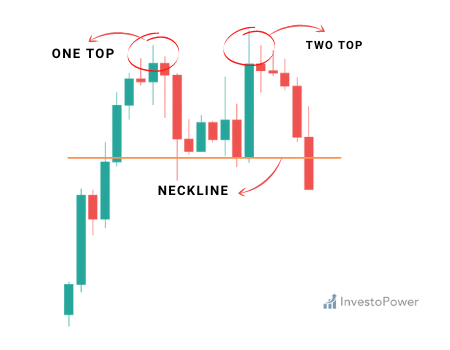
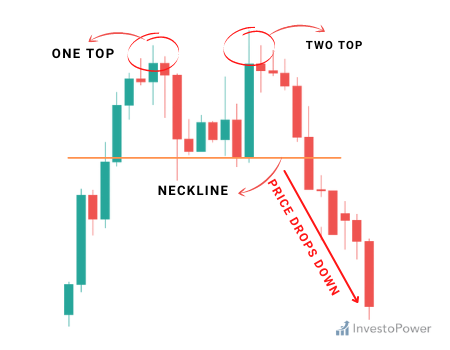
The above pattern in the chart shows a double top
If you look carefully, you will notice that there are two “peaks” in the chart in a very strong upward move. But here the second peak was not able to break the level of the first peak. This is a very important and strong sign that a potential reversal is in the cards. In technical terms, it means the buying spree is coming to an end. In this situation, it is recommended to place the entry order below the neckline because we are anticipating a reversal of the upward trajectory.

The above graph shows price breaking the neckline and making a move down
The lesson to be learned here is that double tops are trend reversal formations. So you will have to look for double tops after there is a strong upward trend. Another important thing to note is that the fall is around the same height as the double top formation.
Double Bottom Chart Pattern:
A double bottom is also a trend reversal formation. But this time instead of buying, we are looking to sell. This kind of formation occurs after an extended downturn when instead of mountains, valleys have formed. In other words, if you put the two top formations upside down then you will see the double bottom formation.
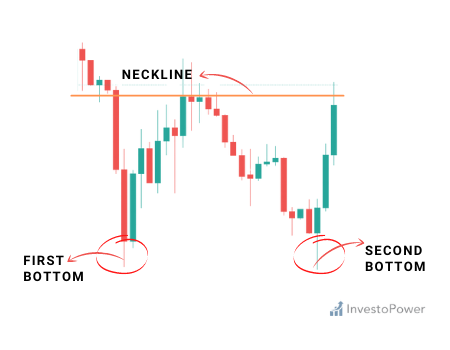
The above chart pattern shows a double bottom
If you look carefully, you will notice that there are two “valleys” in the chart in a very strong downward move. But here the second bottom was not able to break the level of the first bottom. This is a very important and strong sign that a potential reversal is in the cards. In technical terms, it means the selling spree is coming to an end. In this situation, it is recommended to place the entry order below the neckline because we are anticipating a reversal of the downward trajectory.
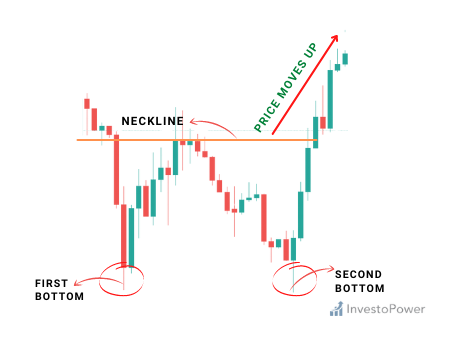 The above graph shows price breaking the neckline and making a move up
The lesson to be learned here is that double tops are trend reversal formations. So you will have to look for double bottoms after there is a strong downward trend. Another important thing to note is that the fall is around the same height as the double bottom formation.
Trading the Head and Shoulders Pattern
As a human, we all have our heads and two shoulders. So do some formations in the pattern in a chart. As a trader, all you have to do is to identify those patterns and take advantage of those opportunities present. Like any other formation, head and shoulders formations also happen in both uptrend and a downtrend. Like double top and double bottoms, head and shoulder patterns also get formed to signal a reversal of a trend.
-
Head and Shoulders Pattern:
Here we are not talking about the head and shoulders shampoo, we are talking about the head and shoulders pattern that can be seen in a chart pattern if looked at carefully. This kind of formation comes into existence like a peak (shoulder), followed by a higher peak (head), and then another lower peak (shoulder). For measuring the distance, a “neckline” is drawn connecting the lowest points of the two bottoms or troughs. The slope of the neckline might be upward-looking or downward-looking.
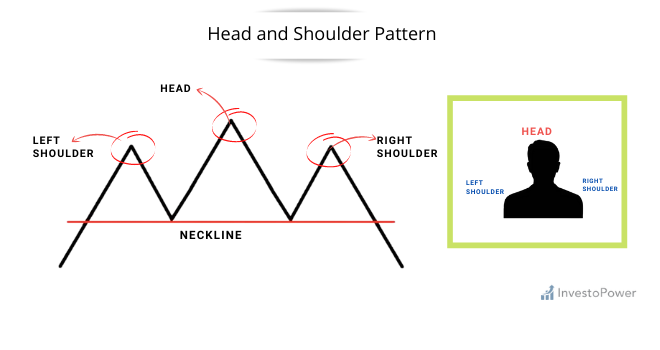
The above chart shows a head and shoulders formation
Here, the head is the second top or peak and is the highest point in the formation. The two soldiers also form peaks but do not cross the height of the head. If this formation is there then we can go for putting an entry order below the neckline. We can also quantify a target by calculating the head to the neckline. This distance signals how far the price will move after it breaches the neckline.
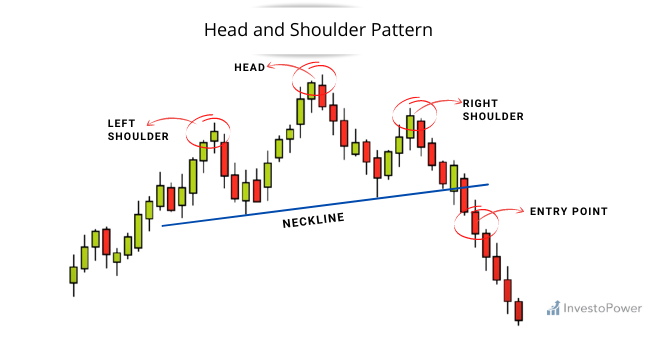
The above chart shows how head and shoulders pattern breakdown
You can notice that once the price goes below the neckline it makes a move that is at least the size of the distance between the head and the neckline.
-
Inverse Head and Shoulders Pattern:
The name is suggestive of the nature of this pattern. It is also a head and shoulder turned upside down. Like double tops, if turned upside down then it will look like a valley. A valley is created when a shoulder is followed by an even lower valley, and then another higher valley. This kind of formation comes into existence after extended downward movements. Like head and shoulders, we should be putting the entry order above the neckline.
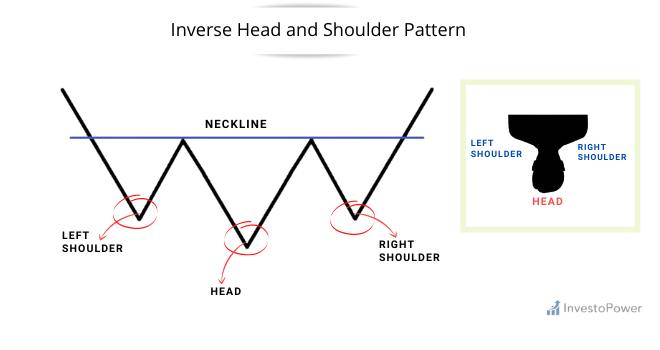
The above chart pattern shows inverse head and shoulder
We can also quantify a target by calculating the head to the neckline. This distance signals how far the price will move after it breaches the neckline. You can check the below chart to see how the prices have been breached.
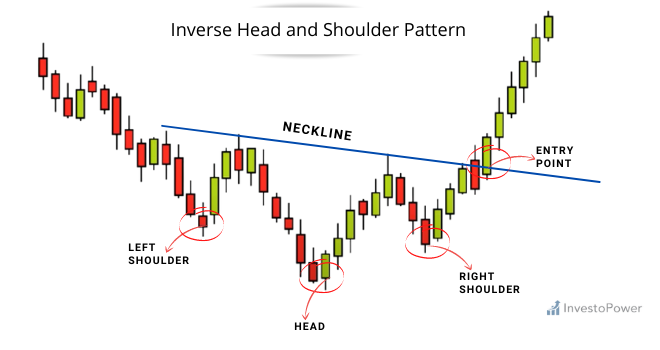
The above chart shows how inverse head and shoulders pattern breakdown
Trading the Wedge Chart Patterns
What is a Wedge Chart Pattern ?
As per the lexicon, a “wedge” means any shape that is triangular in cross-section. This kind of formation can be seen in chart patterns where two trend lines are converging. Unlike the double tops and head and shoulders patterns, this wedge pattern signals a “pause” in the ongoing trend. It also hints at indecision on the part of market participants. If you come across this kind of pattern then feel free to assume that traders are still deciding which destination to take this currency pair. A downward-looking wedge is called a “bullish” chart pattern that comes into being in an upward trajectory. The slope of the line is, of course, downward-looking. An upward-looking wedge is called a “bearish” chart pattern that comes into being in a downward trajectory. The slope of the line is, of course, upward-looking. Since the wedge pattern signals indecision, it may serve as either a “continuation” or “reversal” pattern.
-
Rising Wedge Chart Pattern:
A rising wedge comes into existence when the price of a currency pair starts consolidating between upward sloping support and resistance lines. In the chart presented below, the support line seems steeper than that of the resistance. It signals that higher lows are forming at a fast pace than the higher highs. In situations like this, when the price gets consolidated then be watchful about possible breakout to either the top or the bottom. Here the place of formation is the key. If the rising wedge comes into existence after an upward trajectory then it will signal a bearish reversal pattern. On the other hand, if the rising wedge comes into existence after a downward trajectory then it will signal a continuation of the downward trend.
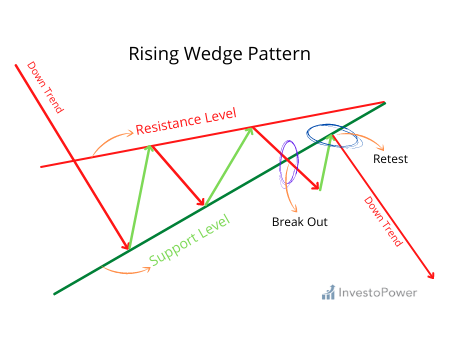
The above chart shows a rising wedge being formed at the end of an uptrend
Looking carefully will reveal that the price action is forming new highs, but at a much slower pace than when price makes higher lows.
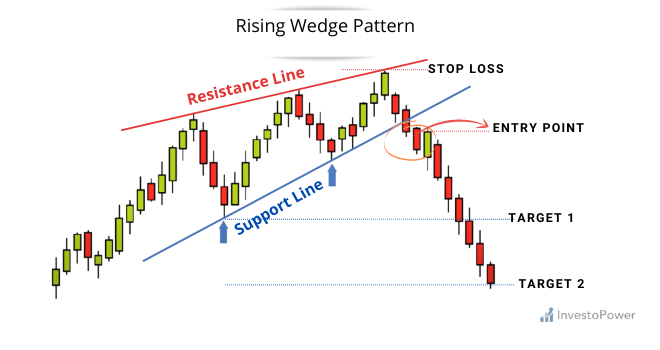
The above chart shows price breaking down to the downside
Here in this chart, you can observe that the currency pair has pushed the price down to breach the trend line. It signals that a downward trajectory might be in the cards. The price movement after the breach is around the same intensity as the height of the formation. Now let’s have an eye at another instance where it is acting as a “bearish continuation signal”. As is visible in the below-given chart, the price came from a downtrend before consolidating and climbing higher highs and even higher lows. In the case of the below-given chart, the price action has broken to the downside and the downward trajectory has continued. This is the main reason why it is called a continuation signal.
The above chart shows higher highs and higher lows
The bottom line here is a rising wedge formed after an upward trajectory often signals a reversal. On the other hand, a rising wedge formed during a downward trajectory results in a continuation of the existing trend.
-
Falling Wedge Chart Pattern:
A falling wedge is just like a rising wedge and it can either signal a reversal or a continuation signal. If it is giving a reversal signal then it will definitely come into existence at a bottom of a downtrend, indicating that an upward trajectory might come next. If it is a continuation signal and if it is formed during an upward trend then it means that the upward price action will continue. Here you must keep in mind that, unlike the rising wedge, the downward wedge is a bullish chart pattern.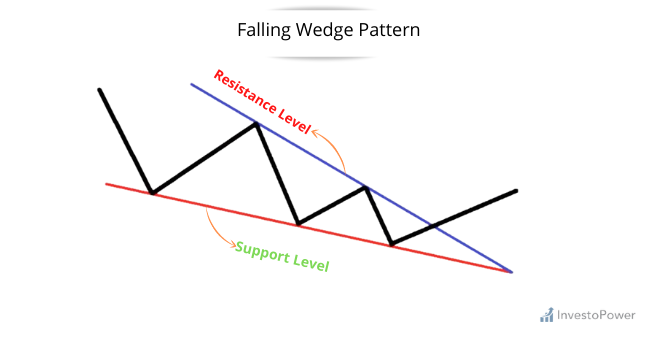
In the above example, the falling wedge is serving as a reversal signal. After, of course, a downtrend, the price action created lower highs and lower lows. If you look at it, you will notice that the falling trend linking the highs is steeper than the trend line linking the lows.
Here it is visible that after breaching the price above, the currency pair made a great move upwards and that is around the height of the formation. Now let’s have a look at an instance where the falling wedge is serving as a continuation signal. Like formations in the uptrend, it often hints that the trend will continue.
In this example, the price consolidated for a bit after a strong showing. This could mean that buyers are undecided and gathering strength.
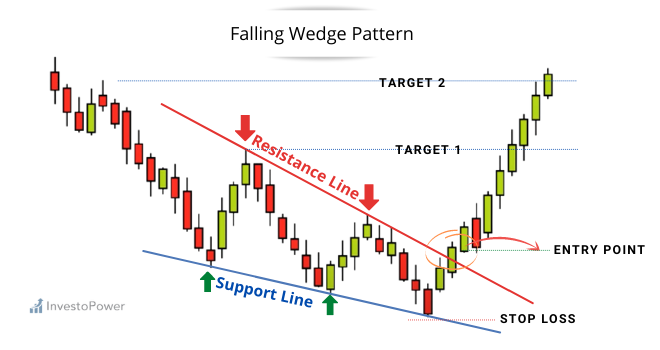
The graph shows price breaks and resumption of the uptrend
The Bottom Line
Since the patterns in a chart were first developed by Japanese rice merchants, chart patterns have proven themselves useful technical indicators for traders around the world. Chart patterns are capable of highlighting areas of support and resistance, which can help a trader decide whether they should open a long or short position; or whether they should close out their open positions in the event of a possible trend reversal.


