Table of Contents
The double bottom pattern is a reversal pattern that can be found in the financial markets. It’s an important pattern to learn and understand because it is often a precursor to a large move in price.
This article will explain what a double bottom pattern is, how it forms, some of the characteristics of the pattern, and how you can trade it.
The Double Bottom Pattern is a bullish chart pattern and price formation that can predict the reversal in a bear market. It has two distinct bottom price levels where the security experiences a sharp decline before rising again. Identifying this pattern involves looking at the price movement of a given asset and gauging whether there is a shift of power between bulls and bears.
KEY TAKEAWAYS
- A double bottom is a technical analysis pattern that indicates that the price of an asset has reached its lowest point, risen significantly, and then dropped back to roughly the same low level.
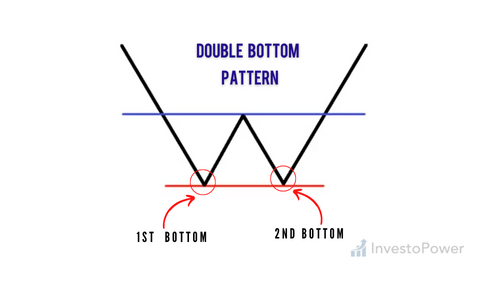
- The double bottom pattern, similar to the letter “W,” indicates a support level.
- A double-bottom pattern is a sign that an overall downtrend has reversed, indicating the beginning of an upward trend.
- Double bottoms can form on many different timeframes and are relatively common.
- A double bottom in a daily chart can signify a long-term reversal or trend change, while a double bottom in an hourly chart often indicates only a short pause in the downward direction.
What is a Double Bottom Pattern?
The Double Bottom Pattern is a chart pattern that represents a reversal of a downtrend, and signals that the price is likely to rise.
A Double Bottom Pattern occurs when an asset’s price reaches a low point twice in a row, and then reverses direction. A double bottom indicates that the price has reached a low point, but also indicates that the volume is increasing as well. This pattern can be seen on any chart that displays historical data, such as stocks, commodities, or currencies.
The pattern is made up of two rounded bottoms that form at approximately the same price level. The second bottom should be higher than the first one by at least 10%, but usually not more than 20% above it. It consists of two troughs (or valleys), separated by a peak (or plateau). There must be enough volume for these two troughs to stand out on the chart; otherwise, there would be no indication of buying interest by investors wanting to reverse an existing downtrend in prices which would mean no change in trend followed by another move lower down again afterward either way around instead!
Why Do We Use It?
The double bottom pattern provides confirmation that an uptrend is underway or will soon begin. It may also be used as a signal for buying stocks or other assets when they are down in price. It may be used as an entry point for buying long-term investments or derivatives based on expectations of future growth in price.
In order to use this pattern, you must wait until there is enough evidence that the stock has turned around and started an uptrend before entering at the right time. You should also use other tools such as moving averages and momentum indicators to confirm that the stock has truly changed direction before making any trades based on this pattern alone.
The double bottom pattern is formed when there are two consecutive bottoms where the price bounces off the support level and then continues to move higher. The first bottom is followed by a higher low, while the second one forms a lower low than the previous low.
The distance between both bottoms should be at least twice as long as the distance between both tops. This pattern indicates that bulls have taken control of the market after bearishness had prevailed for some time, and it also shows that bears are losing their grip on the market.
The Double Bottom Pattern: What Does It Mean?
You’ve probably heard of the double top and double bottom patterns, but what about the double bottom pattern? This pattern is similar to the double top in that it’s a reversal pattern.
The double bottom pattern is made up of two consecutive bottoms that are at or near an extreme low. It can be found at any time, but it’s most common on daily charts. The first bottom can be shallow or steep; this depends on trading volume and price momentum. The second bottom should have a higher volume than the first. The two lows should also be separated by a distance greater than half the height of the first low to qualify as a double bottom formation.
A double bottom pattern is a reversal pattern that forms when the price of an asset drops to a low point, then rises and falls again. The second drop is usually smaller than the first. An uptrend often follows the double bottom pattern in the stock price.
The pattern indicates that there may be an opportunity to buy at a lower price than previously offered. Investors should use caution when entering a position, however, because the stock may continue dropping before returning to its previous level.
What does it mean when you see this pattern?
A completed double bottom indicates a change in trend from downward to upward, which means that after confirmation from price action, you should go long (buy) at market price or above it if there’s enough room for profit potential without risking too much loss potential (stop-loss order). You can also use other indicators alongside this one to confirm before taking action.
Double Bottom Pattern Basic Rules and Criteria
The Double Bottom Pattern is a reversal pattern that serves as a confirmation of the end of a bearish trend. It is characterized by two consecutive bottoms at relatively low prices. The chart below shows the double bottom pattern:
In this article, I will explain everything you need to know about this pattern, including its basic rules and criteria. The Double Bottom Pattern has the following basic rules:
- The first bottom must equal the second one;
- The second bottom must not overlap but touch or nearly touch the first one;
- There should not be any other significant price movements between the two lows such that they are clearly separate from each other;
- There should not be new highs or new lows between these two lows;
How to Trade the Double Bottom Pattern
The double bottom pattern is one of the most popular chart patterns and is easy to spot. The pattern consists of two consecutive bottoms at roughly the same price level with a higher peak in between them.
The double bottom pattern is a reversal formation that indicates that an uptrend may be coming to an end and a downtrend may be starting. In order for the double bottom pattern to be confirmed, there must be a break of the trend line connecting these two troughs on the price chart.
A breakout above the upper trend line will indicate that buyers have taken control and a new uptrend has begun. A breakout below the lower trend line will indicate that sellers have taken control and a new downtrend has begun.
Double Bottom Trading Guide:
The Double Bottom Pattern is one of the most reliable ways to trade in the stock market. With that said, it can be a little confusing to figure out how exactly you’re supposed to trade this pattern. Luckily, we’ve got you covered! Here’s our guide:
- Look for two consecutive bottoms with similar lows and highs (this means that each low should be lower than the previous low, and each high should be higher than the previous high).
- Wait for a break of the resistance level that held back the price from going up (this will mark the end of the first phase).
- Then wait for price action to close above this resistance level (this marks the beginning of phase two). At this point, buy! If you see a new bottom form after buying in at this point then sell your position immediately as this is an indication that you are too early in your trade and may end up losing money on it.
- If the price breaks below support and moves down again, it’s time to cut your losses and exit the trade.
Bottom Line
As you can see, the double bottom pattern is a reliable trading pattern that you can successfully trade on your own. All it takes is some economic knowledge, patience, and good risk management. Even though it’s tested, don’t trade it blindly — always make sure it meets the criteria before trading it. You don’t want to end up with a double top pattern instead!
Learn to spot them, use them, and when to run from them. After a brief discussion on how I noticed that double bottoms work well in both trending and range-bound markets
This is the end of the double bottom pattern article, I hope that this was a helpful read. If you have any questions or recommendations feel free to leave them in the comments below.


