Table of Contents
Hello! Welcome to Bottoming Tail Candlestick, the blog that’s all about making sure you’re always ready for whatever the market throws at you. Whether you’re a beginner or an expert, we’ve got something for everyone—and we’re always adding more content.
Today, we’re going to talk about a very specific type of candlestick pattern: the bottoming tail. It’s one of the most versatile patterns out there and can be used to predict everything from a reversal in a downward trend to confirmation of an upward trend. It is the opposite of the Topping Tail Candlestick Pattern.
So let’s get started!
What is Bottoming Tail Candlestick Pattern?

A Bottoming Tail Candlestick is a type of Japanese candlestick charting pattern that is used to predict reversals in the market. A bottoming tail candlestick is a type of candlestick that indicates a possible reversal of an existing trend.
The main feature of this type of candlestick is the long lower shadow, which is usually at least two times as long as the body. The color of the body is not important, but it should be greater than zero.
A bottoming tail candlestick is a type of candlestick formed by the purchase of a security at a price significantly lower than the previous day’s closing price. It has the appearance of a long lower shadow and short body, with the long lower shadow extending at least two-thirds of the distance from the bar’s open price to its close.
This pattern can appear at the bottom of a downtrend. When this pattern appears at the bottom of a downtrend, it indicates that there has been a significant price decline and that buyers have entered the market, which may lead to an upward trend in prices.
What does the Bottoming Tail Candlestick Tell Investors?
A bottoming tail candlestick is a bearish candlestick pattern that looks like a tall, thin candle with a long lower shadow. The long lower wick indicates that the price has reached its low for the period, while the small body shows that buyers entered the market after the price fell but did not have enough momentum to push it back up again. This type of candlestick forms when the price moves lower for several days and then reverses direction to close near its open price. The narrow upper shadow indicates that there was little buying pressure, while the long lower shadow shows that selling pressure was great.
The bottom of this candlestick represents support and also indicates that bulls have regained control over prices. It is an indication that bears are becoming exhausted and buyers are driving prices higher again. If prices continue to rise after this reversal pattern forms, it could lead to an upward trend or even more gains in price.
When you see a bottoming tail candlestick on your chart, it means that there may be more upward pressure coming for your asset’s price. If you’re looking for an entry point into a stock or other investment instrument, then this could be an excellent time to buy!
The upside of this signal is that it can provide some reassurance for investors who are worried about investing in markets that are falling too much for their comfort level. The downside? It only shows you a possible reversal of direction, not an actual reversal—so you’ll still have to wait for confirmation before acting on your prediction.
What are the characteristics of a bottom-tail candlestick?
A bottoming tail candlestick is a reversal pattern in which the market has been falling and then makes a sharp reversal, moving up. It has three parts to identify this bottom tail pattern:
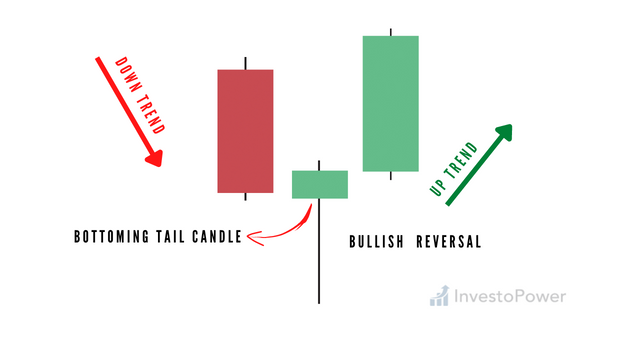
- The first part is a long black body, which shows that there was heavy selling.
- The second part is a small real body (a small white or empty candle), which shows that the sellers have stopped selling but there hasn’t been any buying yet to make the price go up.
- The third part is a long white or empty body, which shows that there was buying and it pushed the price up.
Types of Bottom Tail Candle
First, we need to understand what a bottoming tail candlestick pattern is. A bottom tail occurs after a price has increased on high volume and then the price falls down. With the downward price movement, there is significantly less volume than originally found at the increase. The pattern looks like a cross inside of a rectangle with a downward-slanted bottom falling under the rectangle.
There are three types of bottoming tail candlesticks:
- Bullish Bottoming tail candle
- Bearish Bottoming tail Candlestick
- Neutral Bottoming Tail Candlestick
Of course, we want to only pay attention to the bullish bottoming candle because a bullish one is more effective in market reversal.
How can you trade a “bottoming tail” candlestick pattern?
The Bottom Tail is a type of Candlestick Pattern. It’s important to note that there are many types of patterns that can be used for forecasting price movements and determining entry and exit points. The Bottom Tail is one of the most popular ones because it is easy to spot and it has a high success rate.
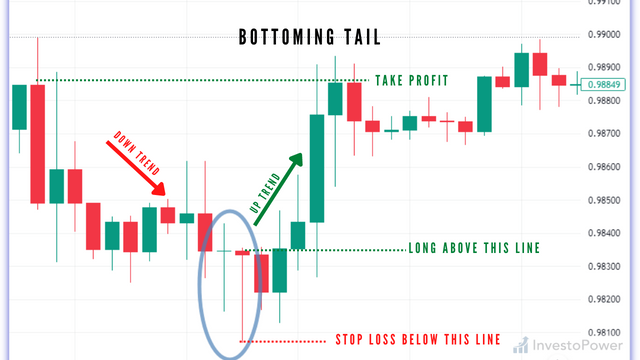
Entry Point: To find the entry point of a bottoming tail candlestick, you’ll need to draw a line from the highest point of the body down to the lowest point. Then, you can use that line as your buy signal. Enter a long position above the signal line.
Stop Loss: Stop loss should be set below the lowest point of the bottoming tail candle.
Take Profit: The risk-to-reward ratio should be 1:2. You can also trail a stop loss as it rises and adjust accordingly.
Exit Point: Once a bearish reversal pattern forms, you can exit all positions.
Bottom Line
There you have it! That’s all there is to understanding Bottoming Tail Candlestick patterns.
The bottom line is that you should wait for a strong candlestick reversal pattern to form before entering a position. This will give you a better chance at success and reduce your risk of losses.
We hope this guide has been helpful, and we encourage you to keep learning about trading and investing.
If you want to learn more about candlestick patterns and how to trade them, check out my Candlestick Trading Guide.


