Table of Contents
This blog will teach you how to identify and use the Topping Tail Candlestick Pattern in your trading strategy. The Topping Tail Candlestick Pattern is an indicator that the current trend is about to reverse, and it can be seen in the up-trends market. It is the opposite of Bottoming Tail Candlestick Pattern.
Many traders will be able to identify Candlesticks patterns but fewer are likely to know about the Topping Tail Candlestick Pattern. This candlestick pattern is one of the most reliable candlestick reversal patterns and has a high success rate.
The bearish candles which have a long upper shadow and little or no lower shadow are the candles that form the topping tail pattern. These are the bearish signals and they are seen on big time frames like daily, weekly, and monthly time frames.
Takeaway:
- The topping tail candlestick pattern is a very simple and straightforward pattern to follow. It is also effective in candlestick trading if done correctly.
- It has implications that a reversal to the downside may be forming.
What is a Topping Tail Candlestick Pattern?
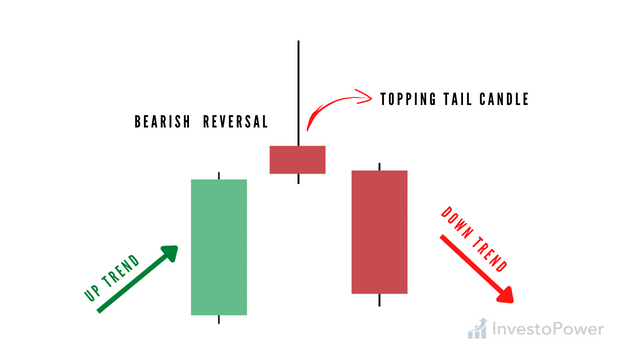
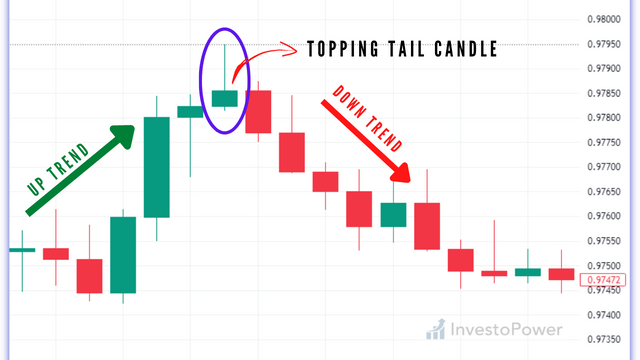
A Topping Tail Candlestick Pattern is a type of candlestick formation that forms at the end of a bullish trend. A Topping Tail Candlestick Pattern has a long upper shadow, a small real body, and a small lower shadow.
The pattern is formed when there is indecision in the market and it fails to break through the resistance level. The indecision can be seen by the fact that the market has failed to close above the previous day’s high or below the previous day’s low, resulting in a narrow real body.
The strength of this pattern depends on how large the upper shadow is compared to the body, how far away from the resistance level the high of this candle was placed and whether or not it was able to close above this resistance level. If all these factors are considered when analyzing this pattern it will give traders confidence in their trade decision and help them avoid making bad trades that could cost them money over time!
What does a Topping tail pattern tell investors?
A topping tail candlestick tells investors that a stock has reached it’s high and is now in a downtrend. The shadow of the candle shows that there is no more room for the stock to climb.
A topping tail candlestick is a reversal pattern that indicates that the current trend may be coming to an end. When this candlestick pattern appears, it means that the price of the asset has reached its highest point for the period and then declined. It can also happen in any time frame, but it is most often seen on daily charts.
This candlestick pattern is considered bearish because it signals that there may be a drop in prices ahead. The topping tail candlestick’s long upper shadow indicates that there was a large amount of selling pressure during this period, while the small real body shows that buying pressure was low or non-existent.
Since this is a bearish signal, investors should wait until after this candlestick pattern has formed before making any trades based on its appearance. If you enter into a position too early, your trade could be stopped before it has even had a chance to work its magic!
The market often makes a lower low after the Pattern forms, which confirms that selling pressure has increased. A move below support levels signals that sellers are in control of price action and it’s time for traders to consider exiting long positions or entering short positions.
How to identify the Topping Tail Candle
- The Topping Tail Candlestick has a short body with a long wick at the top, and it looks like a tail.
- The Topping Tail Candlestick is a bearish candlestick pattern that occurs at the top of an uptrend.
- The candlestick has a long upper shadow, which means that the price made a new high but closed below its open.
- In addition, the body is small compared to the size of the upper shadow, which shows that buying pressure was low during this period.
- The long upper shadow indicates that the price fell significantly after making a new high; hence, it shows that there was a large amount of selling pressure during this period of time.
How to trade the Topping Tail Candlestick Pattern
The topping tail is a bearish reversal pattern that occurs at the top of an uptrend. When you see it in your chart, it means that bears are getting ready to take over.
- You can trade this pattern by placing a sell limit order just below the low of the candle immediately after the candle closes. This means you’ll be selling when the price opens at or below your limit price.
- Stop loss should be set just above the topping tail candle.
- The risk-to-reward ratio should be 1:2 which means if your stop loss is 100 points then the take profit should be 200 points from your entry point.
Bottom Line
That’s it for our Topping Tail Candlestick Pattern article! We hope you learned something new about this pattern and will find it a useful tool in your trading toolkit.
If you liked this article, please let us know by leaving a comment below. If there’s anything else you’d like to learn more about, we’d love to hear from you! You can also check out our other articles.


